Let’s have a look at how listings are doing over the last few months.
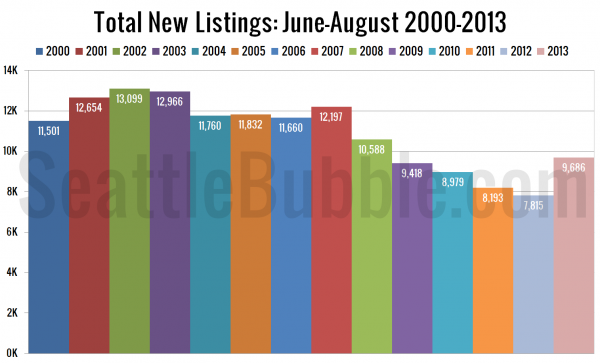
First up, here’s a look at the last three months’ worth of new listings, comparing 2013 to every year I’ve got data for.
June through August 2013 saw more new listings than the same period in 2012, 2011, 2010, and 2009. Things are definitely improving, but we’re still about 23 percent below the pre-bubble average for new June-August listings between 2000 and 2003.
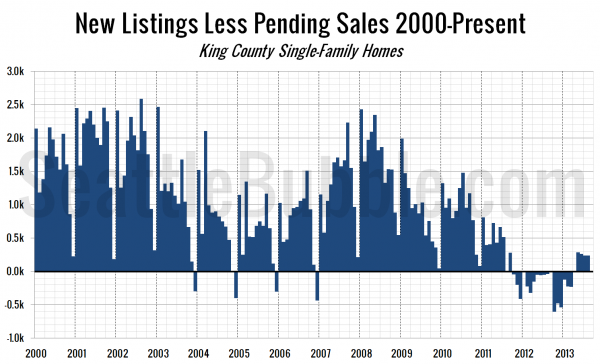
The next chart shows the difference between the number of new listings each month and the number of pending sales. Prior to late 2011 this number was almost always positive, except in December, when very few new listings hit the market. From October 2011 through March 2013 this measure was negative, indicating very tight inventory.
Beginning in April, and continuing through August, this measure has been positive again, but has remained well below its historic average.
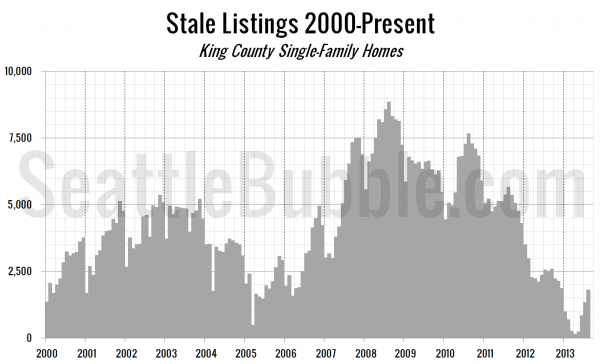
Finally, let’s take a look at the “stale listings” measure, which uses the total listings, new listings, and pending sales counts to estimate how many listings are “carried over” from one month to the next.
Good news for buyers who prefer to take their time and browse listings only after they’ve had time to “season” a bit, as this measure is rapidly recovering from the record lows it hit earlier this year.
Overall the picture is one of listings slowly recovering to normal levels, but not there yet.


