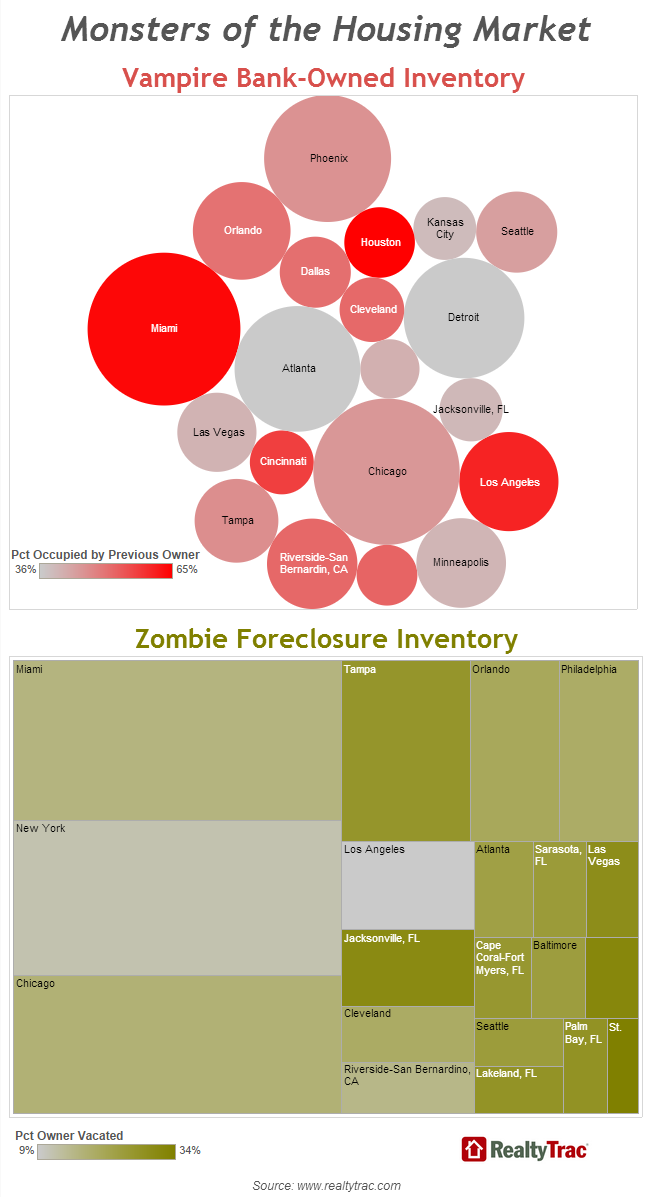
Foreclosure tracking company RealtyTrac came out with an article a few days ago that’s making the rounds among various news outlets: Monsters of the Housing Market: Vampire REOs and Zombie Foreclosures
Here’s an excerpt:
Vampire REOs are bank-owned homes that are still occupied by the previous homeowner who was foreclosed on. On the surface these properties often will look like normal, non-distressed homes, but beneath the surface they represent a shadow inventory that is becoming more imminent as rising home prices motivate banks to sell off these homes to try to recoup their losses on soured loans.
Zombie foreclosures are homes that are still languishing in the foreclosure process but have been vacated by the homeowner being foreclosed. Often these homes are more obviously distressed, falling into disrepair with no one to perform regular maintenance and upkeep.
They go on to claim that 43% of bank-owned homes in the Seattle area are “vampire bank-owned inventory,” 24% are “zombie foreclosure inventory,” and that these types of homes are somehow “threatening the housing recovery.”
Nonsense.
To understand why this is 100% non-news, let’s look again at the foreclosure timeline I posted yesterday:
This data from RealtyTrac simply says that 43% of bank-owned homes in the Seattle area have not yet reached the eviction state. In the above timeline—the fastest that the process could move—a foreclosure is “bank owned” for roughly 60 days. For 20 of these days (between the courthouse auction and eviction), the borrower is still in the home.
In other words, even if the banks were 100% efficient at processing foreclosures, about 33% of bank-owned homes would be so-called “Vampire REOs.” If this number is higher, it just means the bank is taking a little longer to evict, not that there is some large stagnant stash of REOs “threatening the housing recovery.”
Similarly, “zombie foreclosures” are non-news. Here’s how RealtyTrac defines terms in their report methodology:
Report methodology
The RealtyTrac U.S. Foreclosure Market Report provides a count of the total number of properties with at least one foreclosure filing entered into the RealtyTrac database during the month — broken out by type of filing. Some foreclosure filings entered into the database during the month may have been recorded in previous months. Data is collected from more than 2,200 counties nationwide, and those counties account for more than 90 percent of the U.S. population. RealtyTrac’s report incorporates documents filed in all three phases of foreclosure: Default — Notice of Default (NOD) and Lis Pendens (LIS); Auction — Notice of Trustee’s Sale and Notice of Foreclosure Sale (NTS and NFS); and Real Estate Owned, or REO properties (that have been foreclosed on and repurchased by a bank). The report does not count a property again if it receives the same type of foreclosure filing multiple times within the estimated foreclosure timeframe for the state where the property is located.
In other words, they’re defining “in the foreclosure process” to mean everything from the notice of default to the sale of the home by the bank. Again, referring to the timeline above, from Day 230 when the borrower must vacate to Day 281+ when the home sells, the home is empty but “in the foreclosure process.” That’s 51 days out of a 230 day “process,” or 22% of the time—almost the exact same percentage as Seattle’s percent of “zombie foreclosures.”
In some markets banks take longer to process a foreclosure at various steps, due to differing local laws, bank staffing, or foreclosure volumes. These variations, along with variations in how quickly bank-owned homes sell once they hit the market are hardly worth describing as “monsters threatening the housing recovery.”
Finally, you know I love Tableau, but seriously, RealtyTrac, what the heck is this?
How are those visualizations supposed to convey anything even slightly informative? They’re just a jumbled mess of circles and a random stack of rectangles.
Here’s the data in an actual readable form (click the headers to sort):
RealtyTrac “Vampire” and “Zombie” Foreclosure Nonsense
| Market | Total REO | “Vampire” | Total Foreclosure | “Zombie” |
|---|---|---|---|---|
| Atlanta | 20,882 | 35.8% | 9,321 | 23.1% |
| Baltimore | 7,126 | 24.0% | ||
| Birmingham, AL | 4,641 | 40.5% | ||
| Cape Coral-Fort Myers, FL | 7,669 | 26.0% | ||
| Chicago | 28,305 | 44.7% | 73,854 | 17.4% |
| Cincinnati | 5,398 | 57.1% | ||
| Cleveland | 5,523 | 51.6% | 12,175 | 19.4% |
| Dallas | 6,676 | 50.7% | ||
| Detroit | 19,215 | 35.9% | ||
| Houston | 6,582 | 64.7% | ||
| Indianapolis | 7,008 | 31.5% | ||
| Jacksonville, FL | 5,280 | 39.1% | 16,496 | 30.4% |
| Kansas City | 5,220 | 38.5% | ||
| Lakeland, FL | 6,871 | 27.4% | ||
| Las Vegas | 8,287 | 40.0% | 8,217 | 29.1% |
| Los Angeles | 12,992 | 60.6% | 19,168 | 9.1% |
| Miami | 30,868 | 63.9% | 85,907 | 16.4% |
| Minneapolis | 10,624 | 39.7% | ||
| New York | 83,375 | 11.6% | ||
| Orlando | 12,614 | 50.2% | 26,158 | 20.4% |
| Palm Bay, FL | 6,835 | 27.7% | ||
| Philadelphia | 4,881 | 52.3% | 23,461 | 19.1% |
| Phoenix | 21,320 | 45.5% | ||
| Riverside-San Bernardino, CA | 10,801 | 51.7% | 11,090 | 15.4% |
| Sarasota, FL | 8,407 | 24.8% | ||
| Seattle | 8,698 | 43.4% | 6,890 | 24.4% |
| St. Louis | 4,837 | 33.6% | ||
| Tampa | 9,274 | 46.0% | 38,095 | 26.7% |
I could go on a rant about the terrible misuse of bubble and treemap charts, but this guy already did it for me.
In summary: What the heck, RealtyTrac.


