October market stats are now available from the NWMLS. Here’s a snippet from their press release: Home sales "pause" with government shutdown, but brokers mostly bullish on market recovery.
Home sales “paused” during October but prices continued to rise, according to the latest statistics from Northwest Multiple Listing Service. Commenting on year-to-date totals for 2013 compared to 2012, one industry expert remarked, “I would say the real estate market is recovering nicely.”
…
Mike Gain, president and CEO of Prudential Northwest Realty Associates, believes the market has taken a “slight pause,” but emphasized one month’s numbers don’t indicate a trend.“We are two years into what has been a very steady recovery. It’s okay – and actually healthy – to have a slight slowdown,” he remarked. The government shutdown “definitely hurt consumer confidence” and put many would-be buyers on the sidelines, according to Gain.
Yes, let’s blame the shutdown, despite the fact that the trends of increasing inventory and slowly cooling sales have been obvious all year.
On with our usual monthly stats.
NWMLS monthly reports include an undisclosed and varying number of
sales from previous months in their pending and closed sales statistics.
Here’s your King County SFH summary, with the arrows to show whether the year-over-year direction of each indicator is favorable or unfavorable news for buyers and sellers (green = favorable, red = unfavorable):
| October 2013 | Number | MOM | YOY | Buyers | Sellers |
|---|---|---|---|---|---|
| Active Listings | 4,575 | -7.9% | +6.3% |  |
 |
| Closed Sales | 2,187 | -0.6% | +10.4% |  |
 |
| SAAS (?) | 1.12 | -5.8% | +3.3% |  |
 |
| Pending Sales | 2,579 | +2.8% | -3.6% |  |
 |
| Months of Supply | 1.77 | -10.4% | +10.3% |  |
 |
| Median Price* | $426,000 | +1.4% | +15.1% |  |
 |
Feel free to download the updated Seattle Bubble Spreadsheet (Excel 2003 format), but keep in mind the caution above.
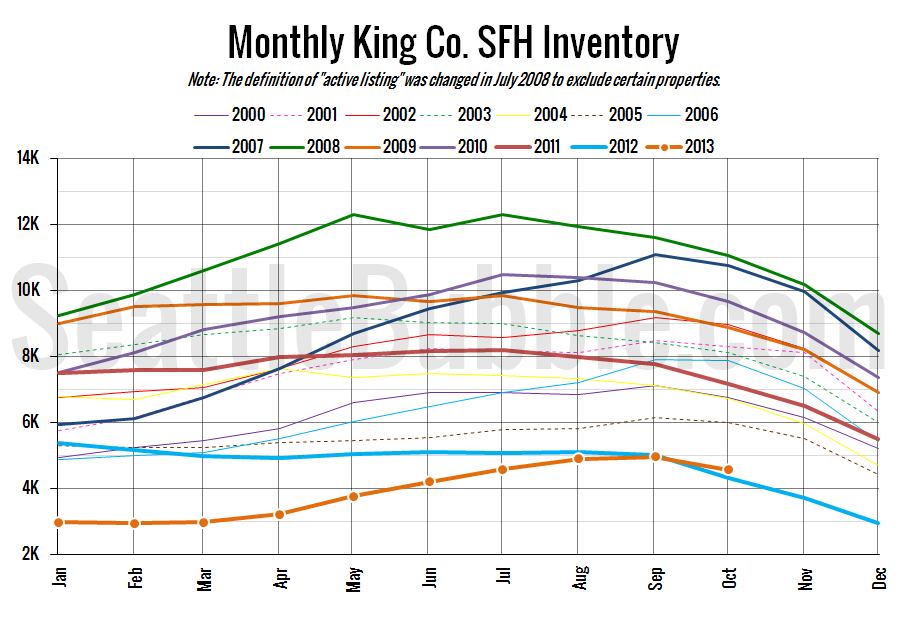
Suddenly a lot of indicators are pointing in buyers’ favor. Inventory was up over 2012 and pending sales were down (despite increasing over September), leading to a decent increase in months of supply.
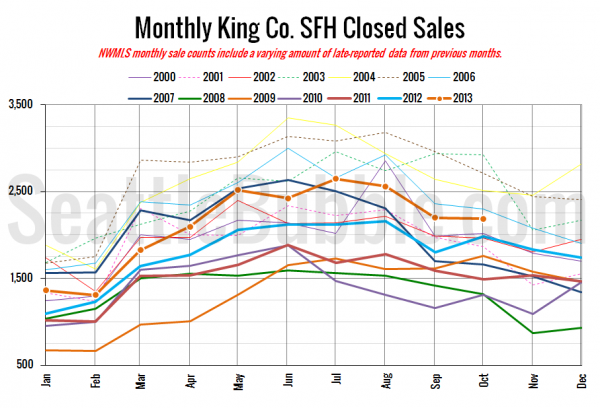
Here’s your closed sales yearly comparison chart:
Closed sales occasionally increase between September and October, but they usually drop. This year they fell slightly.
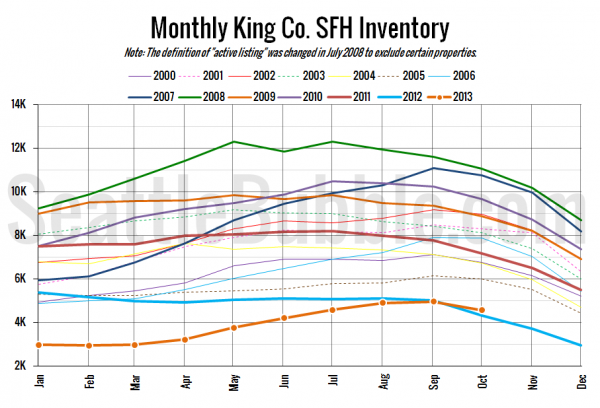
Here’s the graph of inventory with each year overlaid on the same chart.
The year-over-year increase for inventory came in right about where we said it would in our preview yesterday. If the situation continues to improve as it has throughout this year, next spring will be a much less frustrating time for home buyers.
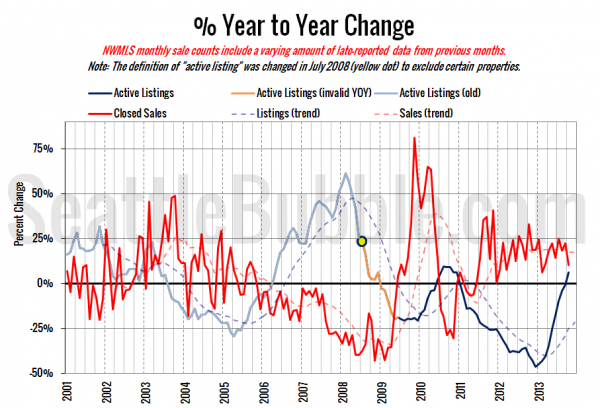
Here’s the supply/demand YOY graph. “Demand” in this chart is represented by closed sales, which have had a consistent definition throughout the decade (unlike pending sales from NWMLS).
The supply trend moved into the black for the first time since December 2010, while the demand trend moved down to its lowest point since February. Things are getting better for buyers but we’re still in “seller’s market” territory.
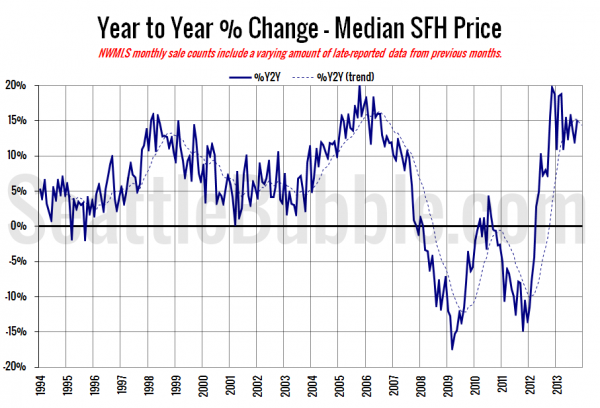
Here’s the median home price YOY change graph:
The median sale price bumped up a bit in October.
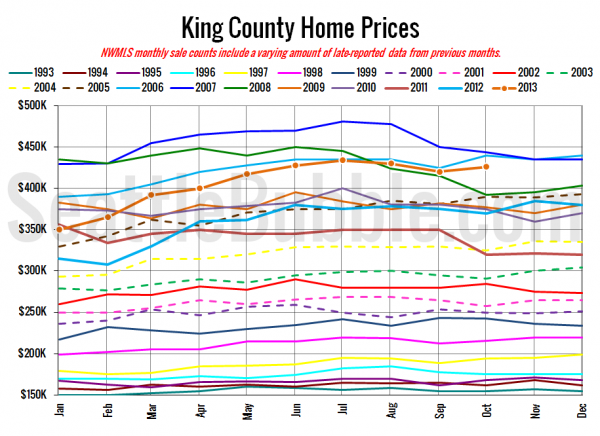
And lastly, here is the chart comparing King County SFH prices each month for every year back to 1994 (not adjusted for inflation).
October 2013: $426,000
May 2006: $427,950
I have not yet seen articles on the Times and P-I, but I will update this post when they are published.
Update: here they are.
Seattle Times: King County median home price up 15% over year ago
Seattle P-I: Was home sales slowdown just a ‘pause’?
Check back tomorrow for the full reporting roundup.
