It’s time for us to check up on stats outside of the King/Snohomish core with our “Around the Sound” statistics for Pierce, Kitsap, Thurston, Island, Skagit, and Whatcom counties.
If there is certain data you would like to see or ways you would like to see the data presented differently, drop a comment below and let me know.
First up, a summary table:
| November 2013 | King | Snohomish | Pierce | Kitsap | Thurston | Island | Skagit | Whatcom |
|---|---|---|---|---|---|---|---|---|
| Median Price | $414,000 | $309,925 | $214,990 | $224,900 | $228,375 | $257,000 | $249,900 | $267,250 |
| Price YOY | 7.5% | 14.4% | 7.5% | -10.6% | 3.2% | -2.8% | 16.2% | 7.3% |
| Active Listings | 3,820 | 2,108 | 3,141 | 1,273 | 1,115 | 644 | 695 | 1,053 |
| Listings YOY | 2.7% | 36.8% | 6.1% | -5.4% | -1.0% | -0.9% | 5.9% | 3.1% |
| Closed Sales | 1,775 | 692 | 825 | 243 | 252 | 96 | 131 | 178 |
| Sales YOY | -2.9% | 1.3% | 3.4% | 8.5% | 29.9% | 4.3% | 18.0% | 5.3% |
| Months of Supply | 1.9 | 2.5 | 3.0 | 4.1 | 3.8 | 6.0 | 4.9 | 5.3 |
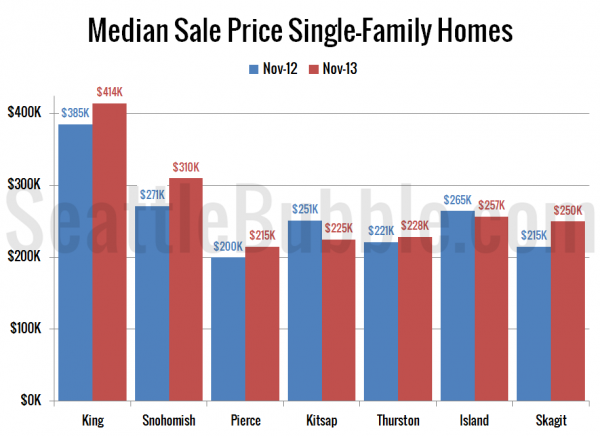
Next we’ll have a look at median prices in November compared to a year earlier. The biggest price gains in November were in Skagit and Snohomish counties, while Island and Kitsap both saw prices lower than a year ago.
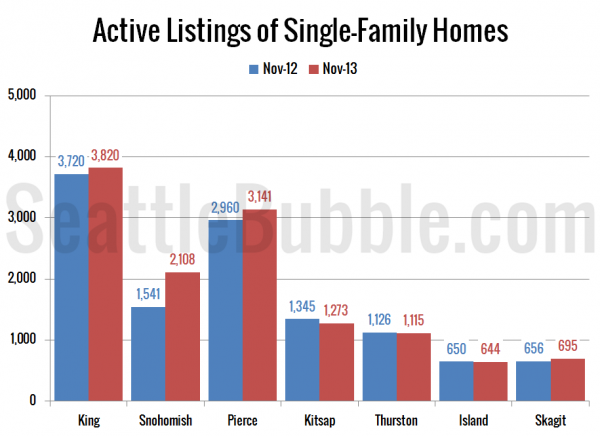
Listings are still down in Kitsap, Thurston, and Island, but they are now up from a year ago in King, Snohomish, Pierce, Skagit, and Whatcom. Snohomish County saw a huge 36.8% jump in listings from a year ago.
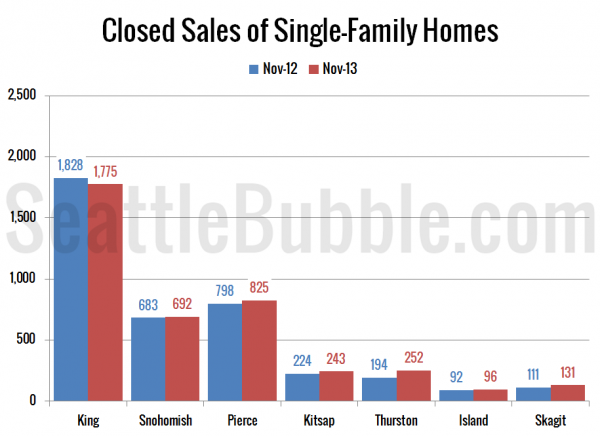
King County was actually the only county to see sales decline from a year ago. The biggest gain in sales was in Thurston, where sales were up 29.9% from November 2012.
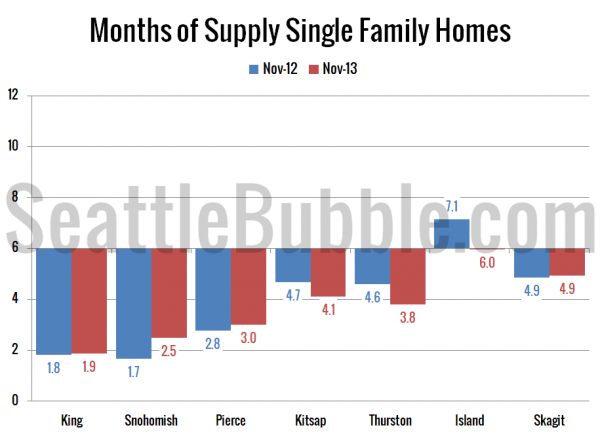
Finally, here’s a chart showing months of supply this November and last November. Months of supply is improving ever so slightly in most counties, but we’re still deep in seller’s market territory.
Overall price gains seem to be moderating as supply and demand come into balance in most counties. We still appear to be on track for next year to be a much less frustrating market for buyers.


