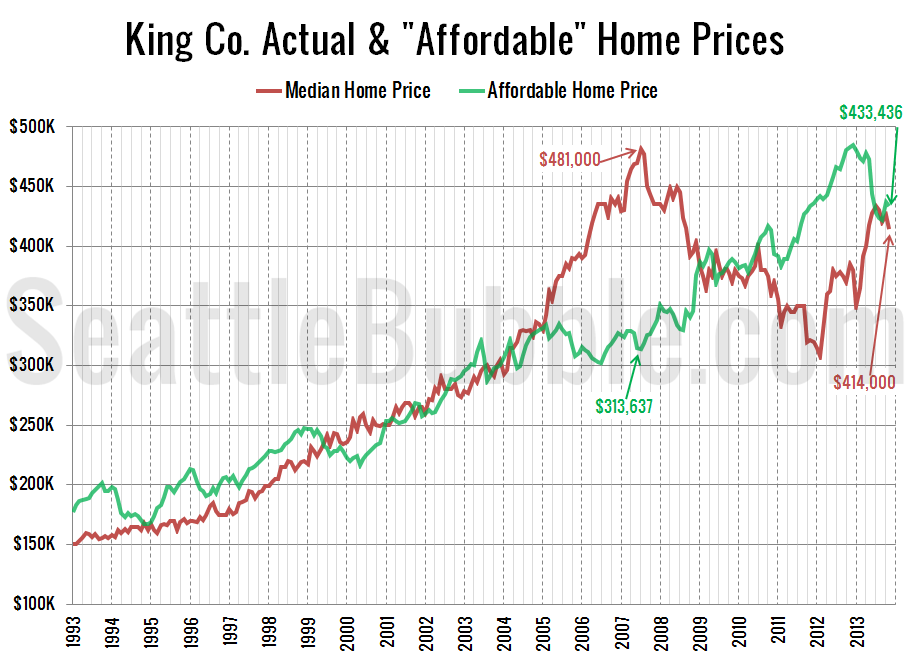
As promised in yesterday’s affordability post, here’s an updated look at the “affordable home” price chart.
In this graph I flip the variables in the affordability index calculation around to other sides of the equation to calculate what price home the a family earning the median household income could afford to buy at today’s mortgage rates if they put 20% down and spent 30% of their monthly income.
After five straight months of declines, the “affordable” home price rose on October, then dipped just slightly again in November. Meanwhile, the median price has fallen from $434,000 in July to $414,000 in November. The “affordable” home in King County now sits at $433,436, with a monthly payment of $1,708.
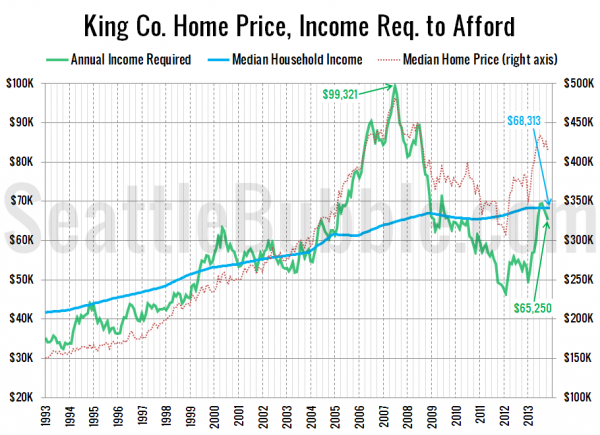
Here’s the alternate view on this data, where I flip the numbers around to calculate the household income required to make the median-priced home affordable at today’s mortgage rates, and compare that to actual median household incomes.
As of November, a household would need to earn $65,250 a year to be able to afford the median-priced $414,000 home in King County (up from the low of $46,450 in February 2012). Meanwhile, the actual median household income is around $68,000.
If interest rates were 6% (around the pre-bust level), the “affordable” home price would drop down to $356,064—14% below the current median price of $414,000, and the income necessary to buy a median-priced home would be $79,428—16% above the current median income.
Recall in July when I said that “I expect home price increases to come to a grinding halt in the second half of 2013.” With only one month left in the year, it looks like that prediction was spot on.


