January market stats were published by the NWMLS yesterday. Here’s a snippet from their press release: Western Washington housing market "definitely in full recovery mode".
Home sales during January may not have been as super as the Seahawks’ performances, but brokers cite several reasons for optimism during 2014. “We are finally going to be looking at the ‘housing crisis’ in the rear view mirror,” said Mike Gain, CEO and president of Berkshire Hathaway HomeServices Northwest Real Estate. “In 2014 we are definitely in full recovery mode,” he added.
Engage propaganda thrusters… Invoke shamless Seahawks plug. FULL SPEED AHEAD!
On with our usual monthly stats.
NWMLS monthly reports include an undisclosed and varying number of
sales from previous months in their pending and closed sales statistics.
Here’s your King County SFH summary, with the arrows to show whether the year-over-year direction of each indicator is favorable or unfavorable news for buyers and sellers (green = favorable, red = unfavorable):
| January 2014 | Number | MOM | YOY | Buyers | Sellers |
|---|---|---|---|---|---|
| Active Listings | 3,132 | +0.2% | +5.3% |  |
 |
| Closed Sales | 1,309 | -27.0% | -4.0% |  |
 |
| SAAS (?) | 1.08 | -11.2% | +3.0% |  |
 |
| Pending Sales | 2,010 | +31.5% | -4.7% |  |
 |
| Months of Supply | 1.56 | -23.8% | +10.5% |  |
 |
| Median Price* | $410,000 | -2.3% | +17.1% |  |
 |
Feel free to download the updated Seattle Bubble Spreadsheet (Excel 2003 format), but keep in mind the caution above.
Prices are still moving in sellers’ favor, but every other indicator is still moving in buyers’ direction. We’re not at a buyer’s market yet, but we’re slowly headed in that direction.
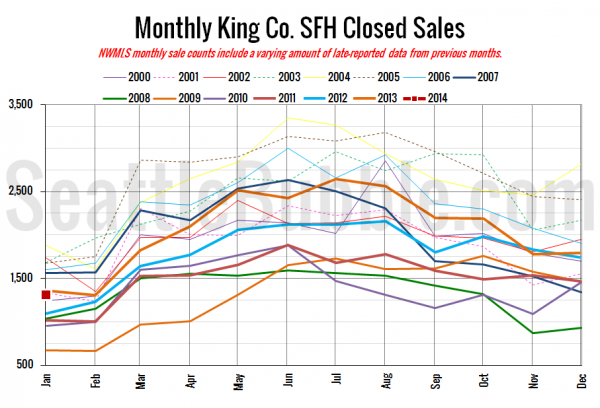
Here’s your closed sales yearly comparison chart:
January this year came in fairly strong compared to many other years, but slightly below last year’s level.
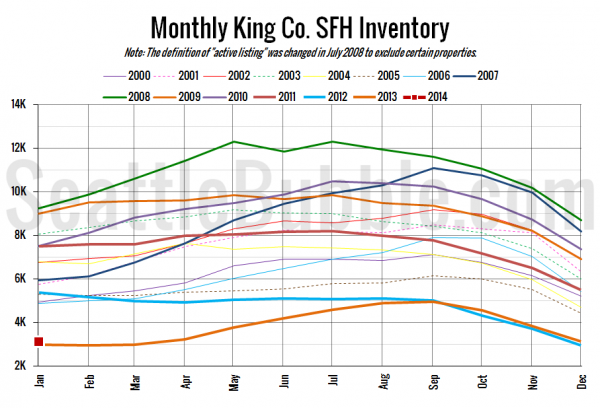
Here’s the graph of inventory with each year overlaid on the same chart.
Second-lowest inventory on record for a January, beating last year just slightly.
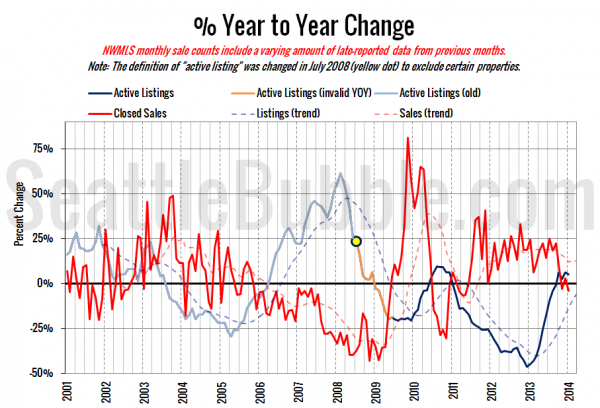
Here’s the supply/demand YOY graph. “Demand” in this chart is represented by closed sales, which have had a consistent definition throughout the decade (unlike pending sales from NWMLS).
The supply trend stayed in the black, while the demand trend inched back into the red, as expected. Things will have to move a bit further from the zero line before we start to see much of a shift in the overall balance of the market.
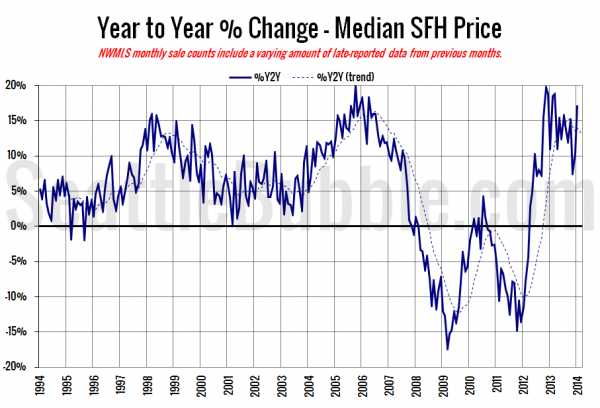
Here’s the median home price YOY change graph:
The median sale price inched back down a bit in January, but not by as much as last year’s December to January dip, so the year-over-year number shot up.
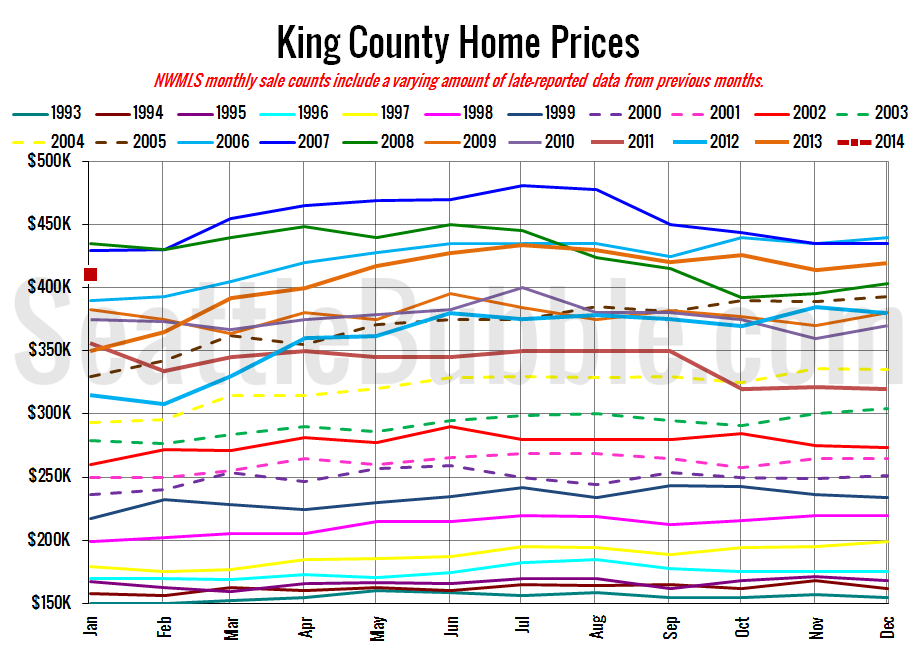
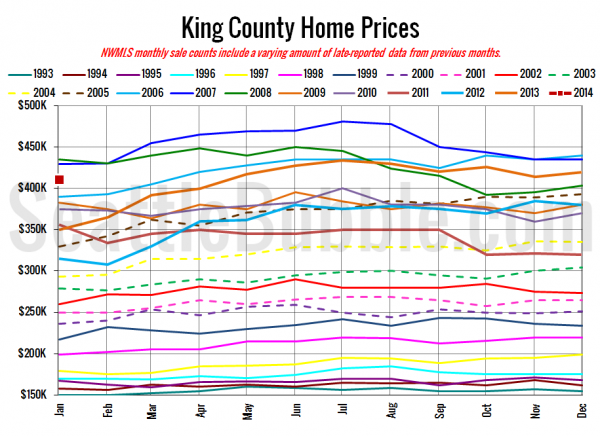
And lastly, here is the chart comparing King County SFH prices each month for every year back to 1994 (not adjusted for inflation).
January 2014: $410,000
March 2006: $405,000
Here are the articles from the Seattle Times and P-I:
This afternoon I will post our usual full reporting roundup.
