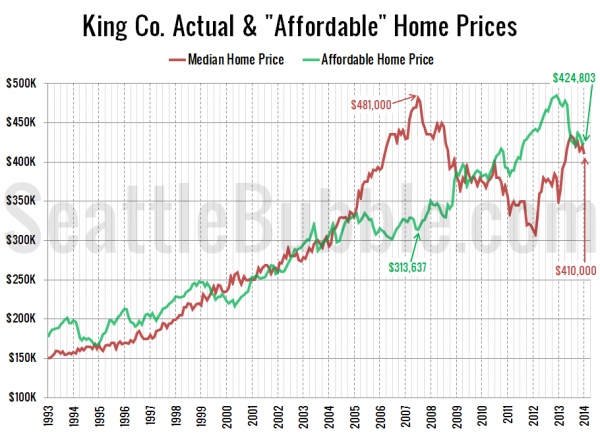
As promised in yesterday’s affordability post, here’s an updated look at the “affordable home” price chart.
In this graph I flip the variables in the affordability index calculation around to other sides of the equation to calculate what price home the a family earning the median household income could afford to buy at today’s mortgage rates if they put 20% down and spent 30% of their monthly income. Note that this chart is not meant to imply that the home price charted is what a family earning the median income should buy. It is just another way of visualizing the affordability index calculations over time.
The “affordable” home price inched up from $423,306 in December to $424,803 in January as the median sale price in the county fell from $419,825 to $410,000 over the same period. The monthly payment on the “affordable” home in King County would be $1,708.
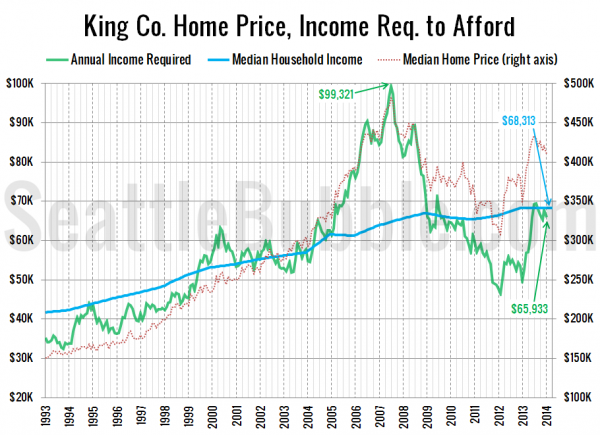
Here’s the alternate view on this data, where I flip the numbers around to calculate the household income required to make the median-priced home affordable at today’s mortgage rates, and compare that to actual median household incomes.
As of January, a household would need to earn $65,933 a year to be able to afford the median-priced $410,000 home in King County (up from the low of $46,450 in February 2012). Meanwhile, the actual median household income is around $68,000.
If interest rates were 6% (around the pre-bust level), the “affordable” home price would drop down to $356,064—13% below the current median price of $410,000, and the income necessary to buy a median-priced home would be $78,661—15% above the current median income.
With the balance between the “affordable” home price and the actual median price hovering right around even lately, it seems doubtful that this spring will see another big surge in home prices without either a renewed drop in interest rates or a loosening of lending standards.


