It’s time for us to check up on stats outside of the King/Snohomish core with our “Around the Sound” statistics for Pierce, Kitsap, Thurston, Island, Skagit, and Whatcom counties.
If there is certain data you would like to see or ways you would like to see the data presented differently, drop a comment below and let me know.
First up, a summary table:
| January 2014 | King | Snohomish | Pierce | Kitsap | Thurston | Island | Skagit | Whatcom |
|---|---|---|---|---|---|---|---|---|
| Median Price | $410,000 | $295,000 | $219,000 | $216,950 | $208,250 | $240,000 | $219,000 | $264,000 |
| Price YOY | 17.1% | 14.1% | 11.7% | -7.6% | -3.1% | 2.1% | 21.7% | 8.1% |
| Active Listings | 3,132 | 1,800 | 2,853 | 1,106 | 1,031 | 543 | 619 | 896 |
| Listings YOY | 5.3% | 33.2% | 9.4% | -1.2% | 4.4% | -2.2% | 5.8% | -1.1% |
| Closed Sales | 1,309 | 492 | 672 | 215 | 238 | 83 | 75 | 129 |
| Sales YOY | -4.0% | -15.2% | 3.4% | 20.8% | 28.6% | 31.7% | -3.8% | 5.7% |
| Months of Supply | 2.4 | 3.7 | 4.2 | 5.1 | 4.3 | 6.5 | 8.3 | 6.9 |
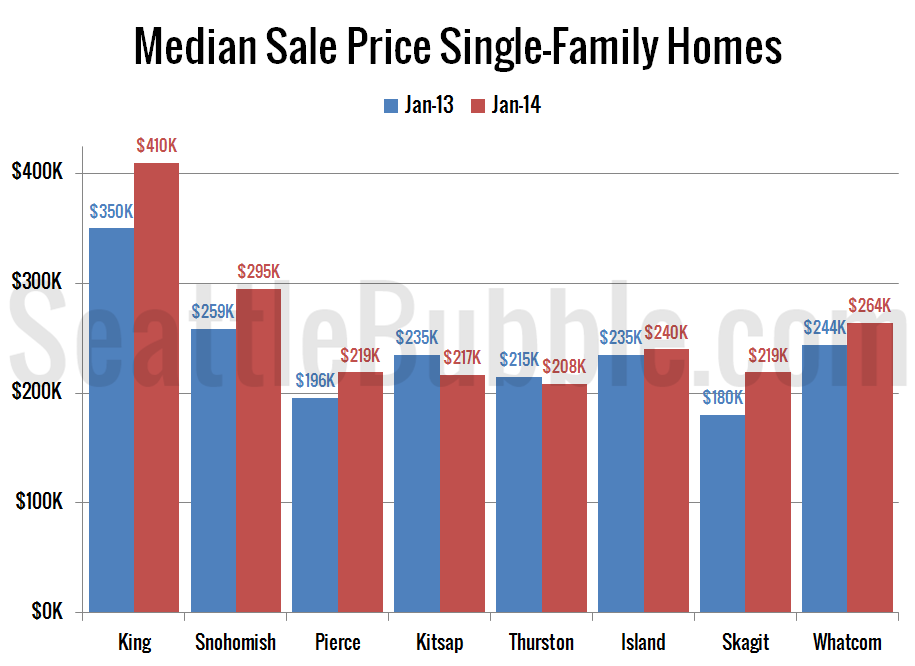
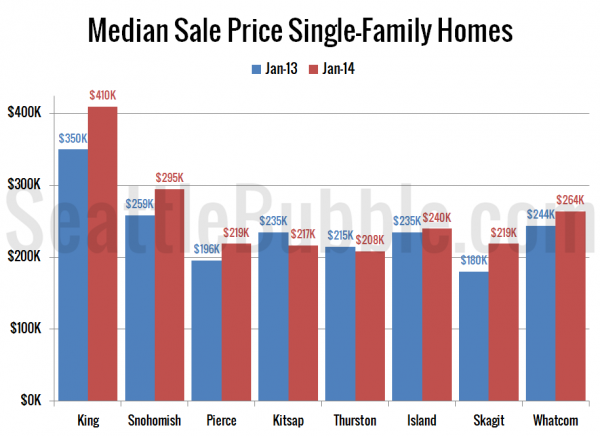
Next we’ll have a look at median prices in January compared to a year earlier. The biggest price gains in January were in King, Snohomish, and Skagit counties again, while Kitsap and Thurston counties saw prices lower than a year ago.
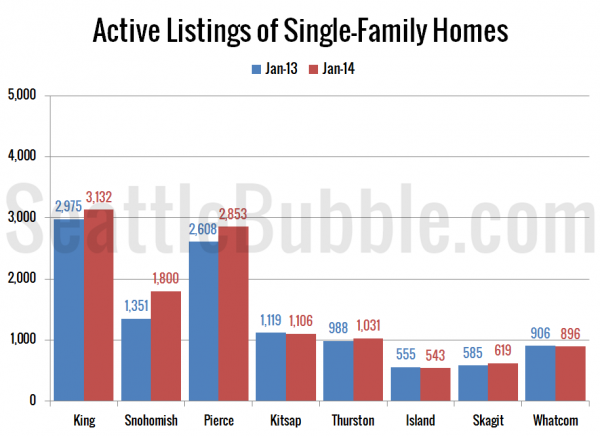
Listings are increasing year-over-year in King, Snohomish, Pierce, Thurston, and Skagit. Listings are still down from a year ago in Kitsap, Island, and Whatcom. Snohomish county continues to post the largest gains with home listings up 33.2% there from January 2013.
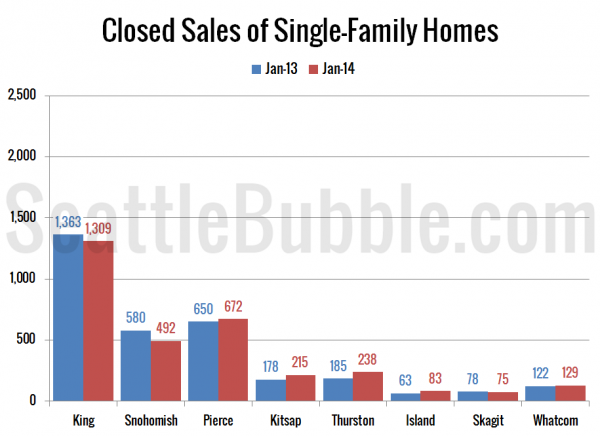
Closed sales fell in January in King, Snohomish, and Skagit, but were up from a year ago in all the other counties.
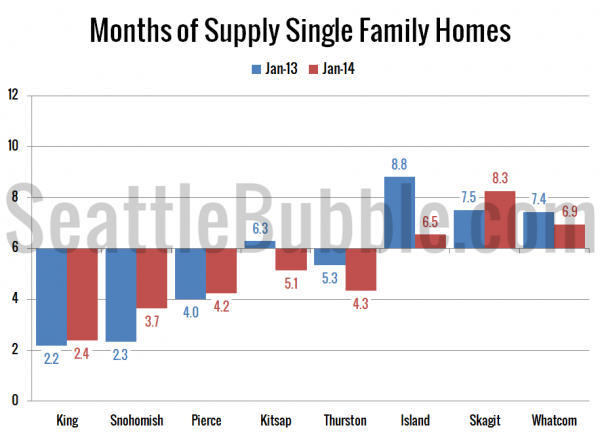
Here’s a chart showing months of supply this January and last January. I’ve switched to calculating months of supply based on closed sales instead of pending sales to remain consistent with what NWMLS is reporting, but this change is easy to apply across the whole data set, so the numbers are still comparable across time. In January Skagit County joined the close-in counties with improvements in months of supply, but the measure is still declining in Thurston, Island, and Whatcom.
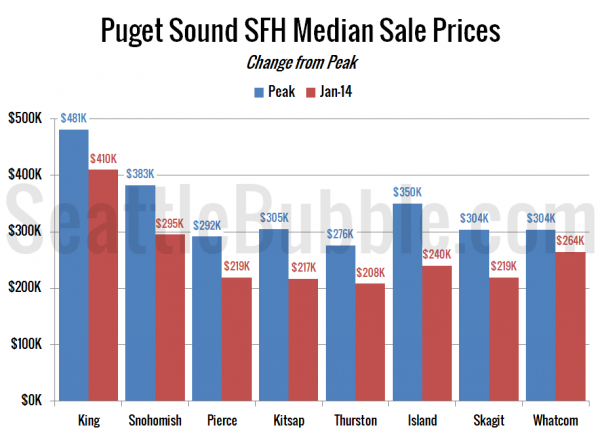
To close things out, here’s a chart comparing January’s median price to the peak price in each county. Everybody is still down between 13 percent (Whatcom) and 31 percent (Island).
It looks like things are slowing down and softening ever so slightly across most of the region. Listings on the rise, sales flat to down, and home price gains shrinking. Without a big surge in listings, this spring is likely to be frustrating for buyers, but not as bad as last year thanks to decreased demand.
