Local home prices gone from undervalued to overvalued in just a year.
In January 2013, Seattle-area home prices as measured by the Case-Shiller Home Price Index were four or five percent below where local per capita incomes would suggest they should have been and one percent below where rents suggested.
By December 2013, massive gains in home prices flipped things around completely, and now homes are three to eight percent overvalued compared to incomes and six percent overvalued compared to rents.
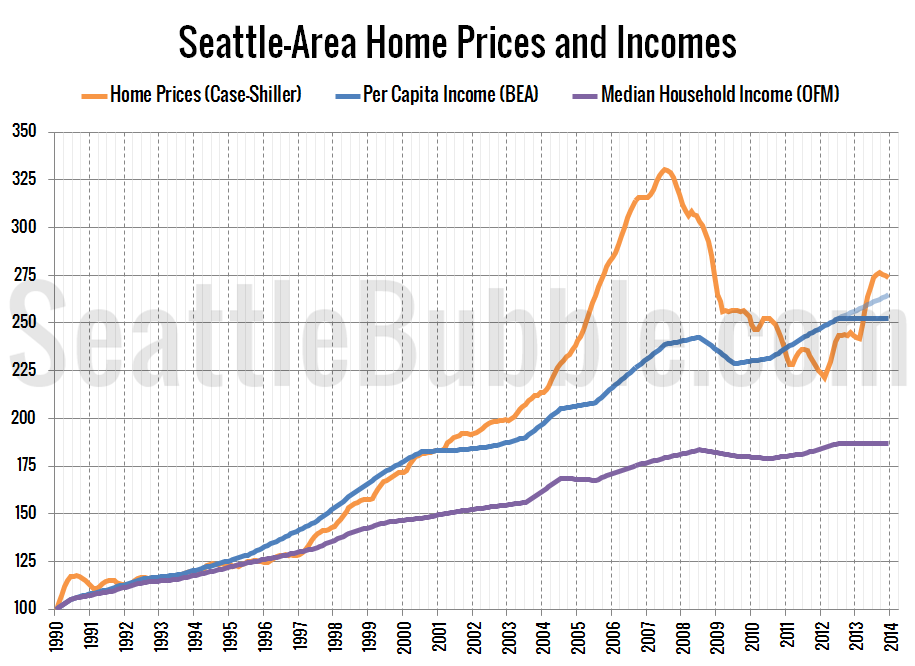
Here’s a look at the prices and incomes chart:
Other than during the bubble years, home prices have tracked fairly closely with average incomes in the Seattle area. However, as prices fell during the bust, they actually dropped below the income trend in early 2011, staying undervalued with respect to incomes all the way through 2012.
Since the latest income data is from 2012, the chart above shows two scenarios for income levels over the past year. The solid line shows incomes flat since 2012, while the semi-transparent line shows incomes increasing at the same rate as the average annual increase 2009-2012. Even under the optimistic assumption that incomes have continued to increase, home prices are still three percent overvalued as of the end of 2013.
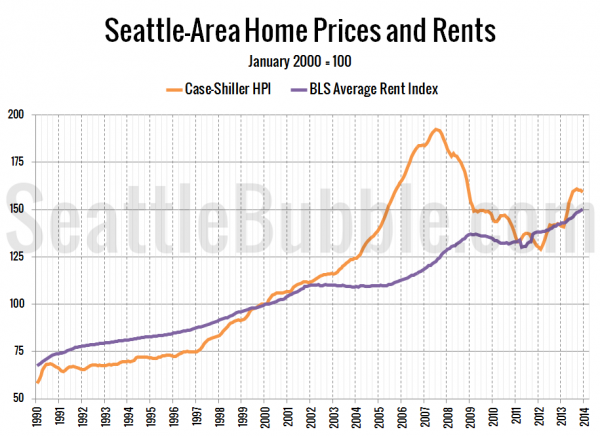
Next, let’s look at prices and rents:
When compared to rents, home prices were undervalued late 2011 through early 2012, then again last winter. As of December though they were six percent overvalued.
Does this mean that we’re in for another bust? Not hardly. At the peak of the housing bubble, home prices were a whopping 39 percent overvalued compared to incomes and 57 percent overvalued compared to rents. Last year was crazy, and the home price gains we saw were not sustainable, but it would take a lot more of the same before we are likely to see another big home price collapse.


