Let’s take a look at how affordability is doing in the Seattle area after the last couple months of changes in home prices and interest rates.
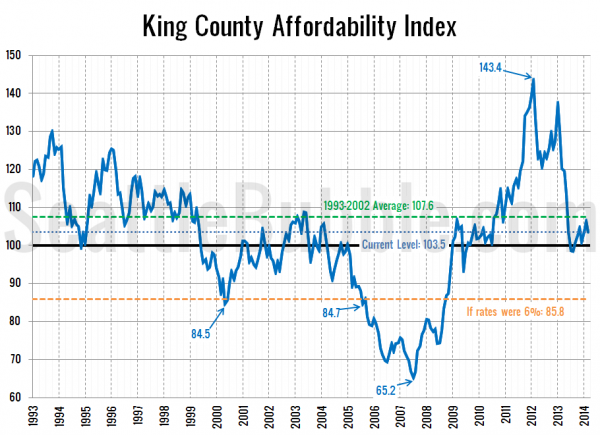
So how does affordability look as of March? Basically on par with the long-term pre-bubble average. The index sits at 103.5, basically the same as January. An index level above 100 indicates that the monthly payment on a median-priced home costs less than 30% of the median household income.
I’ve marked where affordability would be if interest rates were at a more sane level of 6%—85.8. That’s slightly above the pre-bubble low point, and a little better than affordabiliy was in late 2005 when I started this blog.
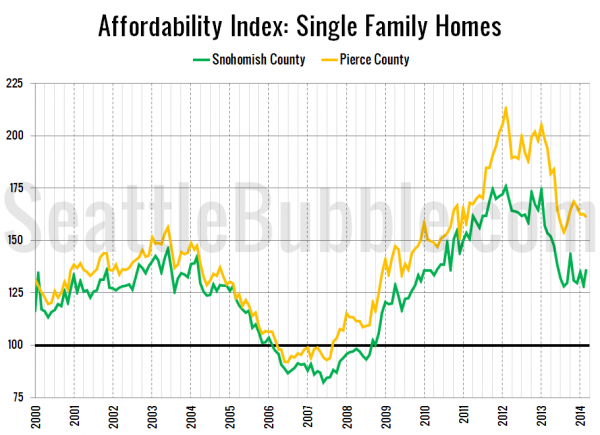
Here’s a look at the index for Snohomish County and Pierce County since 2000:
The affordability index in Snohomish and Pierce is following a similar pattern to King County.
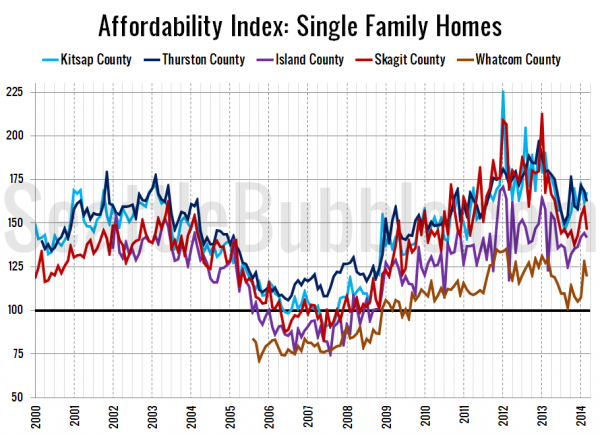
Later today or tomorrow I’ll post updated versions of my charts of the “affordable” home price and income required to afford the median-priced home. Hit the jump for the affordability index methodology, as well as a bonus chart of the affordability index in the outlying Puget Sound counties.
As a reminder, the affordability index is based on three factors: median single-family home price as reported by the NWMLS, 30-year monthly mortgage rates as reported by the Federal Reserve, and estimated median household income as reported by the Washington State Office of Financial Management.
The historic standard for “affordable” housing is that monthly costs do not exceed 30% of one’s income. Therefore, the formula for the affordability index is as follows:
For a more detailed examination of what the affordability index is and what it isn’t, I invite you to read this 2009 post. Or, to calculate your the affordability of your own specific income and home price scenario, check out my Affordability Calculator.


