Before we shelf the March Case-Shiller data, let’s have a look at my favorite alternative Case-Shiller charts.
First up, let’s take a look at the twenty-city month-over-month scorecard. Here’s the original post introducing this chart if you’d like more details. Click the image below to enlarge, or click here for a super-wide version with the data back through 2000.

In just two months, the market has gone from only seven cities experiencing month-over-month gains to nineteen as of March. If this year follows the typical seasonal trend, we’ll probably see this continue at nineteen or twenty through August or September.
Despite this seasonal strength, the second derivative. Only seven cities are posting second derivative gains, up just one from January and February. Click here for the super-wide version.
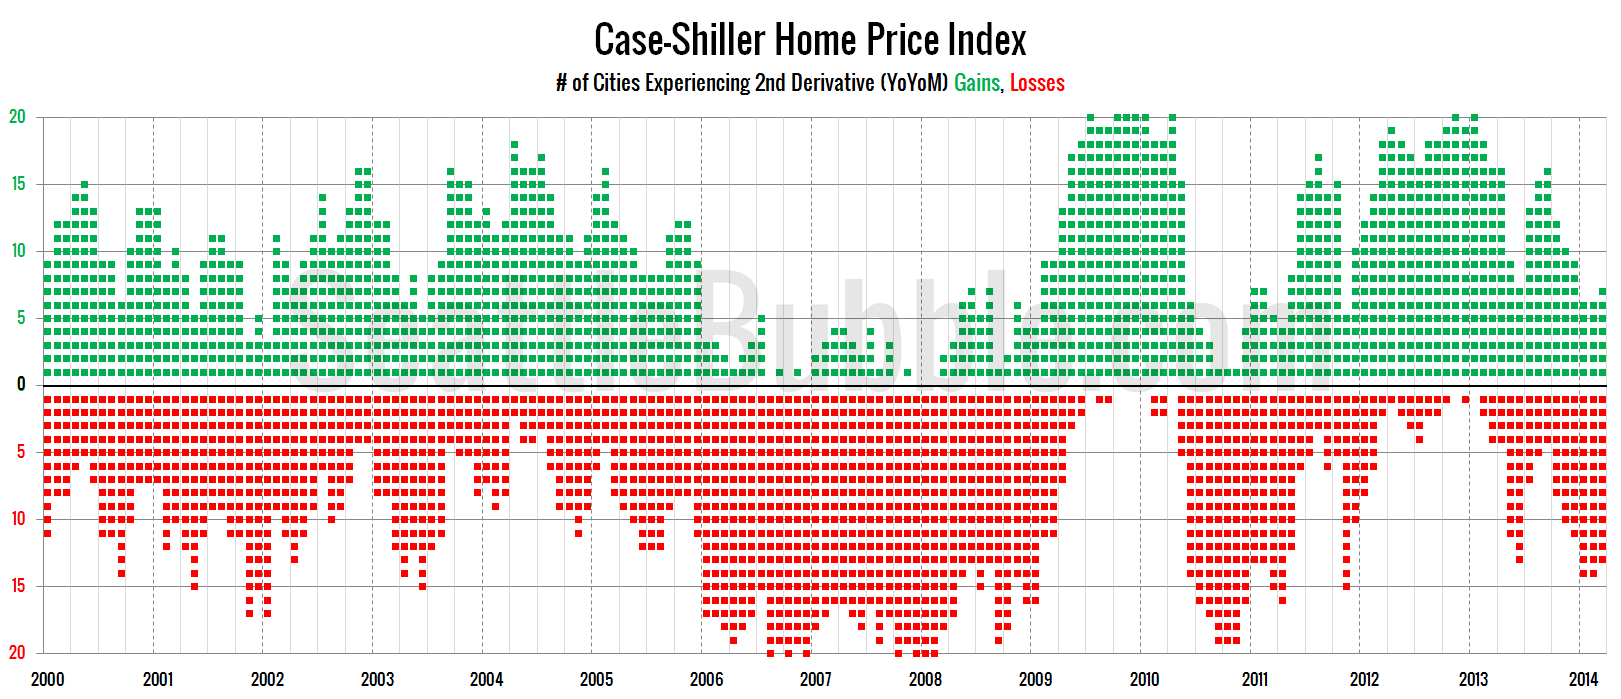
 Gains, Losses - Click to enlarge")
When the market is getting stronger, at least half of the twenty Case-Shiller cities tend to show second derivative gains. The level we’re seeing now is comparable to late 2008.