May market stats were published by the NWMLS this afternoon. Here’s a snippet from their press release: Housing Market Righting Itself as Buyers, Brokers Get Creative to Compete.
Housing around Western Washington is on an upward trajectory, but inadequate inventory “in the right prices and locations” makes for a “very difficult market for purchasers and brokers,” according to an executive with one multi-office real estate company.
…
Mike Gain, a former chairman of the Northwest MLS board of directors, also commented on the bidding wars. “We are experiencing more multiple offers than I have experienced in my 35 years of practicing real estate in this marketplace,” stated Gain, the president and CEO of Berkshire Hathaway HomeServices Northwest Real Estate. “This is a very difficult market for purchasers, our agents and brokers. If we had inventory to handle the demand our pending and sold numbers would be greatly increased,” he believes, adding, “We desperately need good quality inventory.”
I doubt that sales would increase that much with more inventory. Instead it’s much more likely that prices would just stop going up so much.
On with our usual monthly stats.
NWMLS monthly reports include an undisclosed and varying number of
sales from previous months in their pending and closed sales statistics.
Here’s your King County SFH summary, with the arrows to show whether the year-over-year direction of each indicator is favorable or unfavorable news for buyers and sellers (green = favorable, red = unfavorable):
| May 2014 | Number | MOM | YOY | Buyers | Sellers |
|---|---|---|---|---|---|
| Active Listings | 4,158 | +17.4% | +10.6% |  |
 |
| Closed Sales | 2,326 | +15.4% | -7.6% |  |
 |
| SAAS (?) | 1.53 | +4.9% | +16.4% |  |
 |
| Pending Sales | 3,349 | +12.3% | +3.5% |  |
 |
| Months of Supply | 1.79 | +1.8% | +19.7% |  |
 |
| Median Price* | $442,250 | +2.7% | +5.9% |  |
 |
Feel free to download the updated Seattle Bubble Spreadsheet (Excel 2003 format), but keep in mind the caution above.
Inventory did indeed hit double-digit gains in May, while sales continued to fall. Prices were up again, but once again the month-over-month increase was smaller than the same period a year ago.
Median Price April to May 2013: +4.4%
Median Price April to May 2014: +2.7%
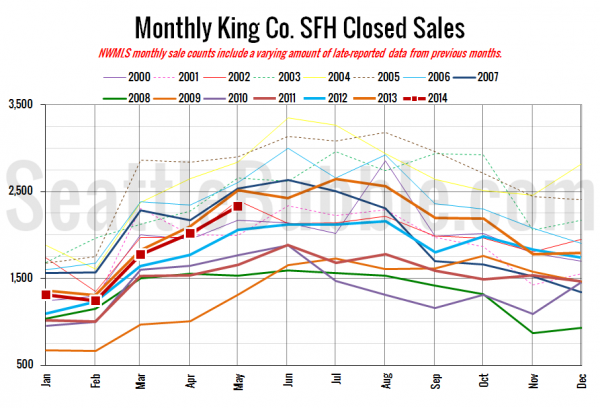
Here’s your closed sales yearly comparison chart:
Not a really high month for sales, and not a really low month either.
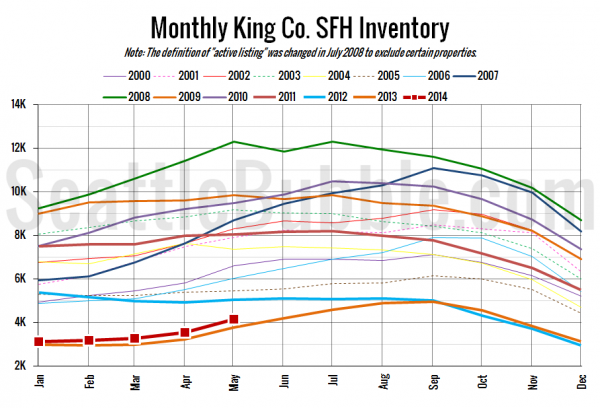
Here’s the graph of inventory with each year overlaid on the same chart.
Another month or two of increases and we should pass 2012 inventory levels, as well. That still isn’t anything to write home about, of course.
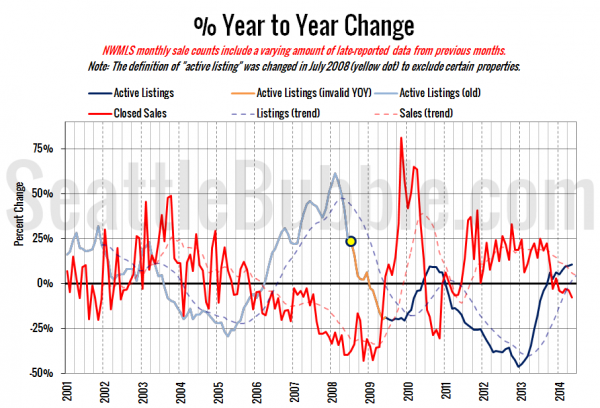
Here’s the supply/demand YOY graph. “Demand” in this chart is represented by closed sales, which have had a consistent definition throughout the decade (unlike pending sales from NWMLS).
Still inching ever slowly toward a buyer’s market, with the supply trend in the black, and the demand trend in the red.
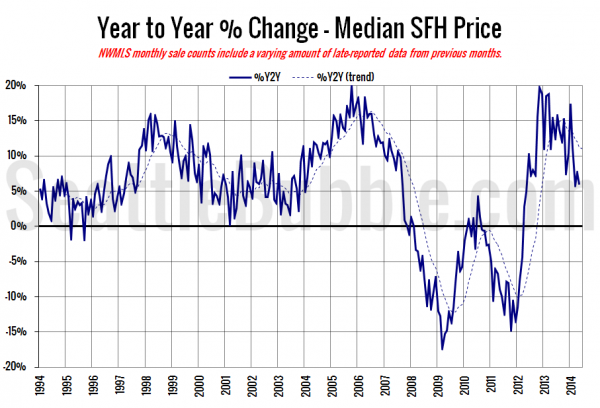
Here’s the median home price YOY change graph:
Down again to 5.9 percent, tied with March for the lowest month since May 2012.
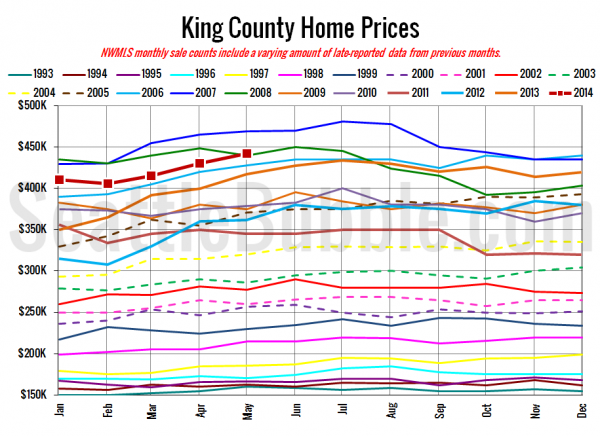
And lastly, here is the chart comparing King County SFH prices each month for every year back to 1994 (not adjusted for inflation).
May 2014: $442,250
October 2006: $440,000
Looks like no story has been posted yet on the Seattle Times. Here’s the link to the Seattle P-I piece: Seattle area had more houses for sale in May
Check back tomorrow for the full reporting roundup.

