June market stats were published by the NWMLS yesterday. Here’s a snippet from their press release: No Summer Slowdown Expected – Brisk Activity Reported.
Listing activity perked up during June, but strong job growth in the Seattle/King County region has brokers predicting brisk sales with competitive bidding throughout the summer.
…
“We are still suffering from low inventory in parts of Snohomish County, and we’re still seeing multiple offers on the majority of new listings,” reported Diedre Haines, regional managing broker in Snohomish County for Coldwell Banker Bain and a director with Northwest MLS. She described the market as “strange,” adding, “We are not feeling or sensing the onset of a typical summer slowdown.”
Nothing about the current market (or any time in the market over the last 9 years, really) is “typical.”
On with our usual monthly stats.
NWMLS monthly reports include an undisclosed and varying number of
sales from previous months in their pending and closed sales statistics.
Here’s your King County SFH summary, with the arrows to show whether the year-over-year direction of each indicator is favorable or unfavorable news for buyers and sellers (green = favorable, red = unfavorable):
| June 2014 | Number | MOM | YOY | Buyers | Sellers |
|---|---|---|---|---|---|
| Active Listings | 4,452 | +7.1% | +5.9% |  |
 |
| Closed Sales | 2,476 | +6.4% | +2.2% |  |
 |
| SAAS (?) | 1.42 | -7.0% | -0.4% |  |
 |
| Pending Sales | 3,175 | -5.2% | +2.7% |  |
 |
| Months of Supply | 1.80 | +0.6% | +3.6% |  |
 |
| Median Price* | $453,500 | +2.5% | +6.1% |  |
 |
Feel free to download the updated Seattle Bubble Spreadsheet (Excel 2003 format), but keep in mind the caution above.
Inventory grew again in June, but the year-over-year rate slowed down. Meanwhile, sales flipped from falling to climbing, and prices were up again. Price growth May to June was almost exactly the same as last year.
Median Price May to June 2013: +2.4%
Median Price May to June 2014: +2.5%
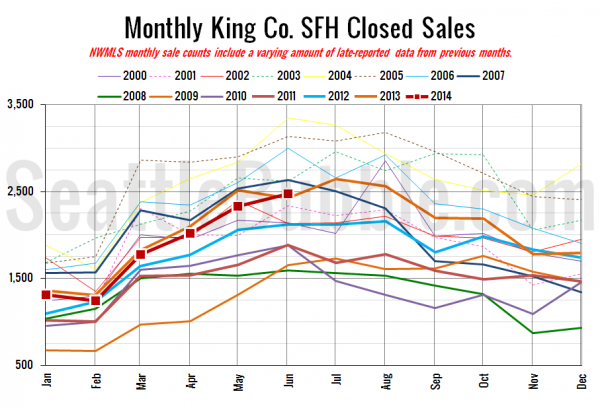
Here’s your closed sales yearly comparison chart:
Sales hit year-over-year growth mainly because this same time last year saw a month-over-month drop, while this year rose.
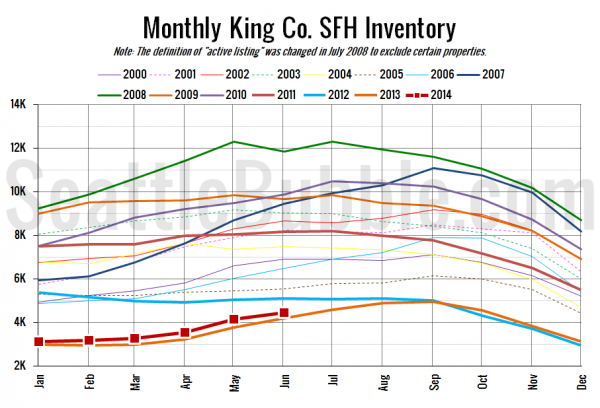
Here’s the graph of inventory with each year overlaid on the same chart.
Still inching upward, maybe fast enough to surpass 2012 inventory levels before the end of the year.
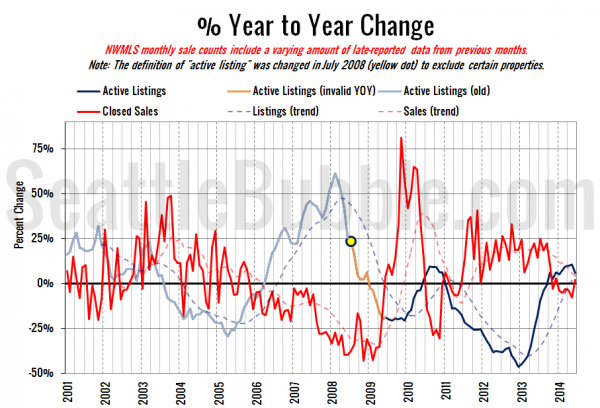
Here’s the supply/demand YOY graph. “Demand” in this chart is represented by closed sales, which have had a consistent definition throughout the decade (unlike pending sales from NWMLS).
The latest movement in this chart was definitely in sellers’ favor, with the supply line moving down and the demand line moving up.
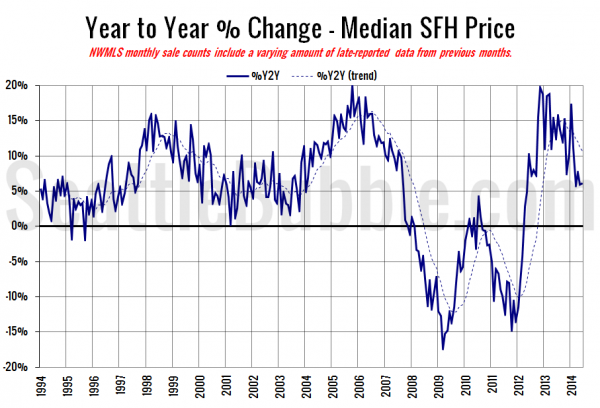
Here’s the median home price YOY change graph:
Still hovering in the 5-6 percent range.
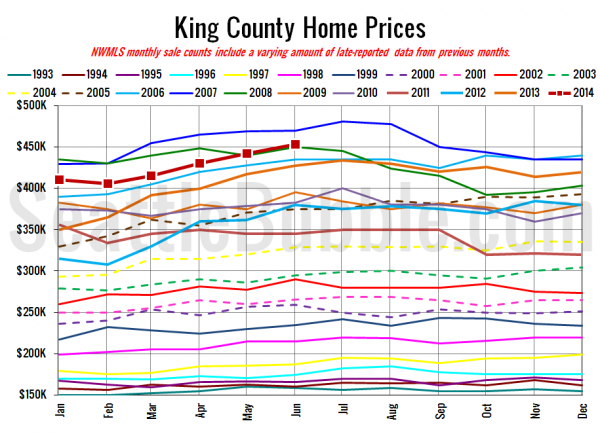
And lastly, here is the chart comparing King County SFH prices each month for every year back to 1994 (not adjusted for inflation).
June 2014: $453,500
March 2007: $454,950
Here are the articles from the Seattle Times and P-I:
Seattle Times: King County home prices up 6 percent over year
Seattle P-I: Home supply ticks up but remains tight
Since today’s a holiday, I’m going to hold off on the reporting roundup until Monday. See you then. Happy Independence Day!

