After seeing quite a bit of uproar in real estate industry circles about Zillow’s new “Coming Soon” feature (a.k.a. pocket listings for dummies) last month, I decided to see how popular actual usage of the feature was a few weeks after the big launch. After all, actions speak louder than words.
Last week I spent some time gathering data on Zillow to see how many “Coming Soon” listings there were on the site, state-by-state across the entire nation. In order to give us something to compare to, I also grabbed the number of “Make Me Move” (a.k.a. delusional owner dream machine) and “For Sale By Owner” (a.k.a. make me an obvious lead target for desperate listing agents) listings, two of Zillow’s other off-MLS categories.
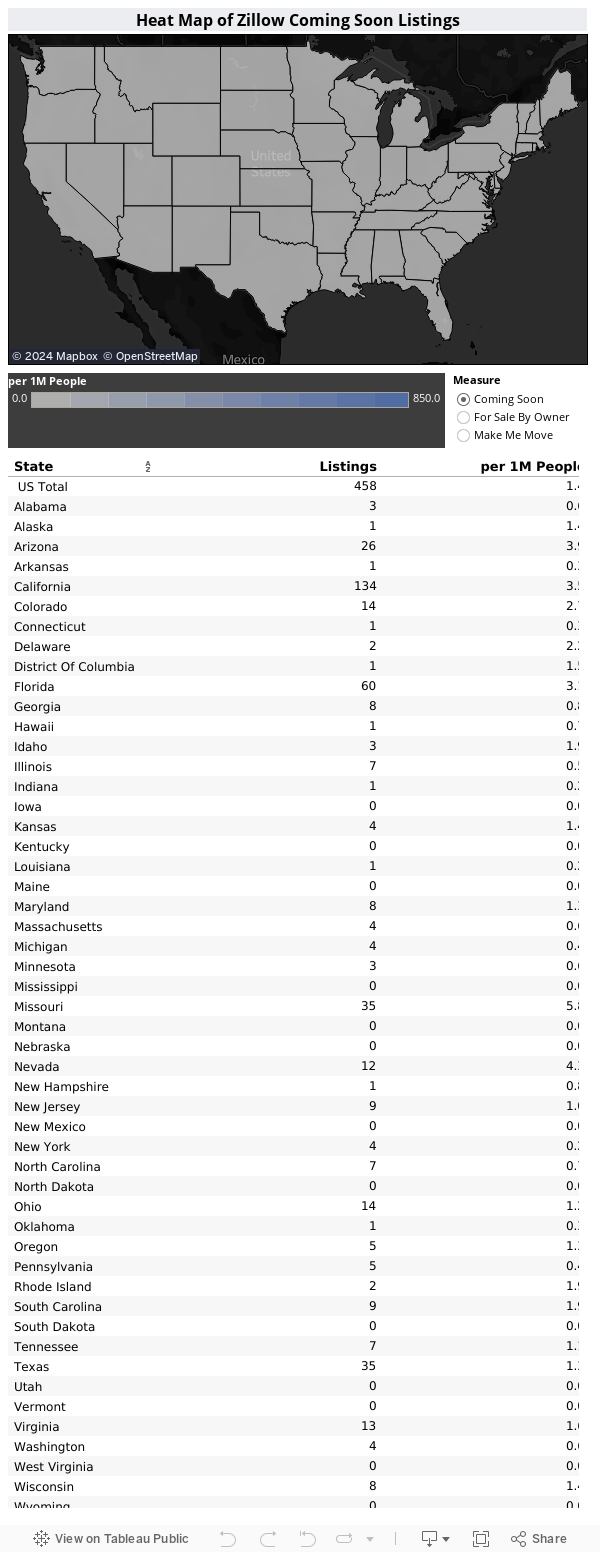
Below is a Tableau heat map of the results normalized by each state’s population (zoom out to view Alaska and Hawaii, or shift-click and drag to pan the map). As you can see, agents who can use “Coming Soon” have so far been slow to do so. This should not be surprising, considering that many MLSs across the country forbid this kind of practice from their members, just like NWMLS does.
So far, the feature is most popular least ignored in Missouri and Nevada—the only two states with more than four “Coming Soon” listings per 1 million residents. Thirteen states had no “Coming Soon” listings at all when I pulled this data from Zillow last week.
Obviously this feature has a long ways to go before it will even come close to the popularity of “Make Me Move,” whose lowest state rate was 56 listings per million residents in Louisiana. The state with the highest rate of “Make Me Move” listings was Washington, with 587 per million residents. The highest rate for FSBO listings was 823 per million residents in Vermont, while the lowest was 73 listings per million residents in California.
On the day I pulled this data the four “Coming Soon” listings in Washington were all either in the Vancouver or Spokane areas (both served by different MLSs). Interestingly, there are now two “Coming Soon” listings in the Seattle area, one in Snohomish and one in Issaquah. Both of the listing agents, Nathanael Hasselbeck of NWG Real Estate and Darrell Parker of Parker Property, LLC appear to be NWMLS members, so I’m a bit surprised to see them openly flout the rules like this, given how fine-happy the NWMLS has been in the past. But hey, they did have to check a box, so I’m sure there’s nothing to worry about.
[Update: As of 3PM, both of these Seattle-area “Coming Soon” listings have been removed.]
Katie Curnutte, a Zillow spokeswoman, said that they were aware of the NWMLS rules when they launched the service. She said they respect those rules, and are not actively encouraging agents to break them.
“It is a marketing tool for agents, so they need to follow the marketing rules of their own MLS and brokerage,” she said. If agents are not acting within the rules of the local MLS, Curnutte said they will remove the “coming soon” listing. She also noted that agents must check a box that they are complying with local MLS rules before posting.
It will be interesting to see what these numbers look like a year from now. So far, all the outrage and concern in the agent community seems to be much ado about nothing.
If you prefer simple text-based tables to Tableau, click through below for all the data in a single table, sortable by clicking the column headers.
| State | Coming Soon | CS-Rate | Make Me Move | MM-Rate | FSBO | FSBO-Rate |
|---|---|---|---|---|---|---|
| Alaska | 1 | 1.4 | 114 | 155.1 | 284 | 386.3 |
| Alabama | 3 | 0.6 | 644 | 133.2 | 2,207 | 456.6 |
| Arkansas | 1 | 0.3 | 374 | 126.4 | 1,757 | 593.7 |
| Arizona | 26 | 3.9 | 1,883 | 284.2 | 1,800 | 271.6 |
| California | 134 | 3.5 | 6,103 | 159.2 | 2,788 | 72.7 |
| Colorado | 14 | 2.7 | 2,286 | 433.9 | 1,576 | 299.1 |
| Connecticut | 1 | 0.3 | 819 | 227.7 | 779 | 216.6 |
| District Of Columbia | 1 | 1.5 | 196 | 303.2 | 64 | 99.0 |
| Delaware | 2 | 2.2 | 182 | 196.6 | 265 | 286.3 |
| Florida | 60 | 3.1 | 1,996 | 102.1 | 7,644 | 390.9 |
| Georgia | 8 | 0.8 | 2,256 | 225.8 | 3,342 | 334.5 |
| Hawaii | 1 | 0.7 | 151 | 107.5 | 108 | 76.9 |
| Iowa | 0 | 0.0 | 294 | 95.1 | 1,708 | 552.7 |
| Idaho | 3 | 1.9 | 306 | 189.8 | 684 | 424.3 |
| Illinois | 7 | 0.5 | 2,431 | 188.7 | 3,796 | 294.7 |
| Indiana | 1 | 0.2 | 841 | 128.0 | 2,388 | 363.4 |
| Kansas | 4 | 1.4 | 261 | 90.2 | 1,015 | 350.7 |
| Kentucky | 0 | 0.0 | 450 | 102.4 | 1,962 | 446.4 |
| Louisiana | 1 | 0.2 | 261 | 56.4 | 1,643 | 355.2 |
| Massachusetts | 4 | 0.6 | 1,586 | 237.0 | 1,075 | 160.6 |
| Maryland | 8 | 1.3 | 1,413 | 238.3 | 1,040 | 175.4 |
| Maine | 0 | 0.0 | 142 | 106.9 | 623 | 469.0 |
| Michigan | 4 | 0.4 | 1,944 | 196.5 | 3,939 | 398.1 |
| Minnesota | 3 | 0.6 | 1,141 | 210.5 | 1,045 | 192.8 |
| Missouri | 35 | 5.8 | 1,165 | 192.7 | 2,507 | 414.8 |
| Mississippi | 0 | 0.0 | 189 | 63.2 | 1,094 | 365.7 |
| Montana | 0 | 0.0 | 128 | 126.1 | 526 | 518.1 |
| North Carolina | 7 | 0.7 | 2,396 | 243.3 | 3,752 | 381.0 |
| North Dakota | 0 | 0.0 | 44 | 60.8 | 240 | 331.8 |
| Nebraska | 0 | 0.0 | 176 | 94.2 | 766 | 410.0 |
| New Hampshire | 1 | 0.8 | 198 | 149.6 | 388 | 293.2 |
| New Jersey | 9 | 1.0 | 1,497 | 168.2 | 2,390 | 268.6 |
| New Mexico | 0 | 0.0 | 259 | 124.2 | 685 | 328.5 |
| Nevada | 12 | 4.3 | 565 | 202.5 | 444 | 159.1 |
| New York | 4 | 0.2 | 2,150 | 109.4 | 4,854 | 247.0 |
| Ohio | 14 | 1.2 | 2,252 | 194.6 | 4,164 | 359.9 |
| Oklahoma | 1 | 0.3 | 678 | 176.1 | 1,762 | 457.6 |
| Oregon | 5 | 1.3 | 1,741 | 443.0 | 1,422 | 361.8 |
| Pennsylvania | 5 | 0.4 | 2,019 | 158.1 | 3,403 | 266.4 |
| Rhode Island | 2 | 1.9 | 206 | 195.9 | 186 | 176.9 |
| South Carolina | 9 | 1.9 | 985 | 206.3 | 2,022 | 423.5 |
| South Dakota | 0 | 0.0 | 50 | 59.2 | 238 | 281.7 |
| Tennessee | 7 | 1.1 | 1,668 | 256.8 | 2,994 | 460.9 |
| Texas | 35 | 1.3 | 3,485 | 131.8 | 4,897 | 185.2 |
| Utah | 0 | 0.0 | 903 | 311.3 | 973 | 335.4 |
| Virginia | 13 | 1.6 | 2,042 | 247.2 | 2,407 | 291.4 |
| Vermont | 0 | 0.0 | 73 | 116.5 | 516 | 823.5 |
| Washington | 4 | 0.6 | 4,093 | 587.1 | 2,402 | 344.6 |
| Wisconsin | 8 | 1.4 | 811 | 141.2 | 2,422 | 421.8 |
| West Virginia | 0 | 0.0 | 151 | 81.4 | 641 | 345.7 |
| Wyoming | 0 | 0.0 | 60 | 103.0 | 275 | 472.0 |
| US Total | 458 | 1.4 | 58,058 | 183.7 | 91,902 | 290.7 |
Data in this post was collected from Zillow.com on June 30, 2014.