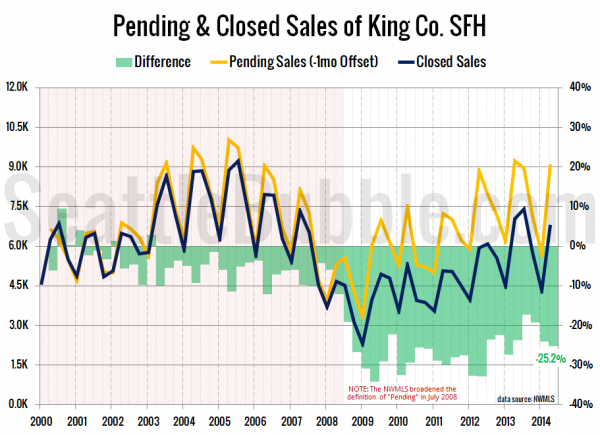
Let’s take a look a the latest data on pending sales volume versus closed sales volume.
For this series I roll the pending sales and closed sales data up by quarter, with pending sales offset by one month. In other words, the second quarter numbers below represent pending sales from March, April, and May and closed sales from April, May, and June.
As of the second quarter, one in four pending sales (25.2 percent) were still failing to ever show up in the closed sales numbers.
With the housing market as hot as it has been for most of the last year and a half, I had been expecting this number to shrink down to closer to 10 percent, but it has instead actually risen since this same time last year, when 23.8 percent of pending sales failed to close.
Apparently one in four pending sales falling out of contract for one reason or another has become the new normal for the housing market. This is likely due to a combination of various factors, including the NWMLS’ redefinition of “pending” in July 2008 as well as buyers simply becoming a lot more picky.
This is good news for buyers, since many homes that quickly go pending may end up back on the market, giving buyers a second chance.
It will be interesting to see if this number changes much over the next year, but given how long we’ve seen it at these ~20%+ levels, I’ve become doubtful that we’ll be seeing it drop down to 10 percent any time soon.

