Let’s take one more look at this week’s Case-Shiller data. Specifically, the rate of change in the year-over-year rate of change, also known as the second derivative.
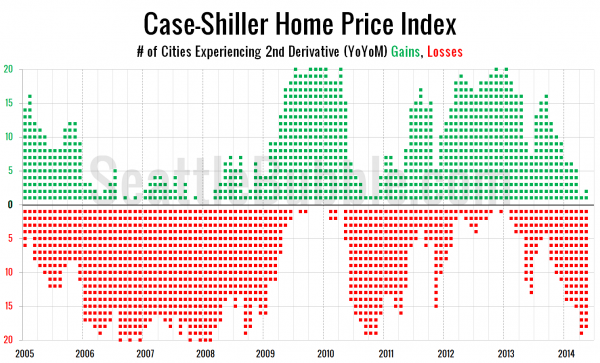
First, let’s take a look at the direction the second derivative is moving in the 20 cities tracked by Case-Shiller. In this chart green dots represent cities with increases and red dots represent cities with declines. Click here for the super-wide version.
In April only Boston saw an increase in its year-over-year price gains, while in May only Tampa (barely) and Charlotte increased. The only other periods in the past that have seen so few cities with increasing price gains were the period immediately following the expiration of the homebuyer tax credit in 2010 and the periods immediately preceding and following the peak of home prices in 2006 and 2007.
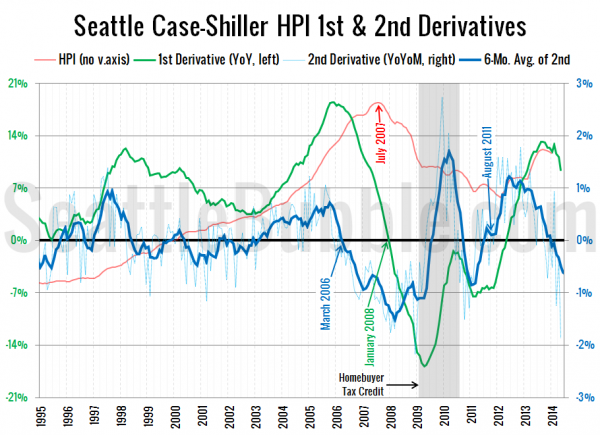
Here’s a more detailed look at Seattle’s second derivative:
Seattle’s second derivative reading in May of -1.9 percent is the lowest level we’ve seen since December 2008.
Leading up to the home price peak in Seattle the second derivative was in the red for 17 straight months. Although the current level is comparable to the period in late 2007 / early 2008 when home prices in Seattle finally began to decline, we’ve currently only seen three consecutive months of negative readings on the second derivative.
I think it’s still a bit early to call another price peak, but the trend is definitely worth keeping an eye on. If things continue the way they have the last few months, we could definitely start to see price declines by this time next year.


