August market stats were published by the NWMLS today. Here’s a snippet from their press release: Western Washington housing market stability continues with modest gains in sales, prices.
“Stability” seemed to characterize the direction of Western Washington’s housing market during August, according to new figures from Northwest Multiple Listing Service.
Both the volume of sales and prices rose slightly from a year ago, although both indicators slipped somewhat from July. MLS members also reported a modest year-over-year increase in inventory, but the number of new listings added to the selection during August was the smallest since April.
“What we are seeing now with the market is a moderated growth in appreciation, a normalizing of sales volume, and continued health overall,” declared MLS director George Moorhead, the owner and designated broker at Bentley Properties in Bothell. “It is not a call for alarm,” Moorhead emphasized, describing it as “just a balancing and adjusting of a healthy market.”
Compared to usual enthusiastic, back-patting, celebratory tone we’ve seen in these releases lately, this month’s issue is downright somber. But nobody panic! Everything is stable. There is no call for alarm.
Okay, let’s get on with our usual monthly stats.
NWMLS monthly reports include an undisclosed and varying number of
sales from previous months in their pending and closed sales statistics.
Here’s your King County SFH summary, with the arrows to show whether the year-over-year direction of each indicator is favorable or unfavorable news for buyers and sellers (green = favorable, red = unfavorable):
| August 2014 | Number | MOM | YOY | Buyers | Sellers |
|---|---|---|---|---|---|
| Active Listings | 4,967 | +2.2% | +1.4% |  |
 |
| Closed Sales | 2,384 | -10.6% | -6.9% |  |
 |
| SAAS (?) | 1.33 | -1.5% | +2.2% |  |
 |
| Pending Sales | 2,782 | -4.1% | -2.2% |  |
 |
| Months of Supply | 2.08 | +14.2% | +8.9% |  |
 |
| Median Price* | $437,000 | -6.6% | +1.6% |  |
 |
Feel free to download the updated Seattle Bubble Spreadsheet (Excel 2003 format), but keep in mind the caution above.
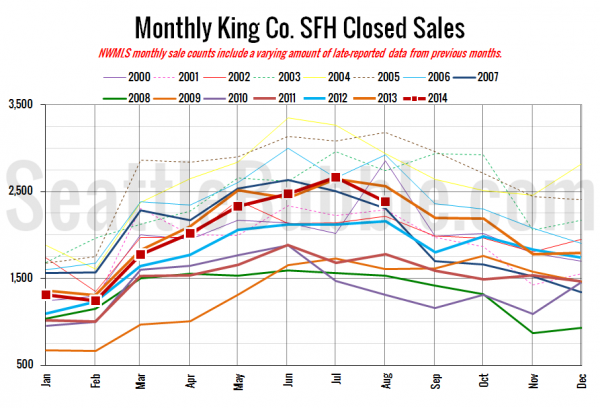
The big story this month is two-fold: closed sales and the median price both dropped considerably between July and August. Only one August on record (going back through 1993) has seen a bigger month-over-month decline in closed sales, August 2010 at -10.9% just barely edged out this August at -10.6%. Prior to this year, on average between July and August closed sales actually increased 1.8%.
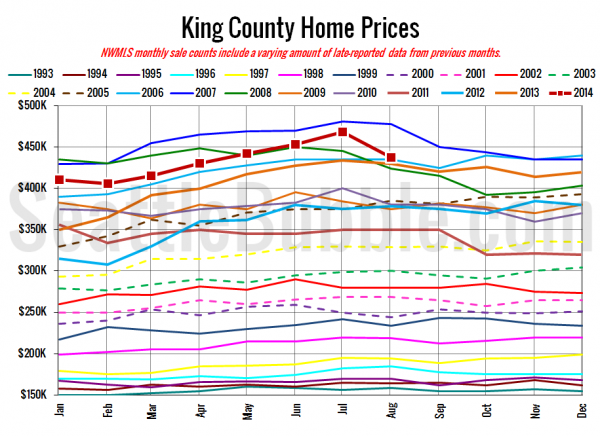
The second big story is the median price, which fell a whopping 6.6% in the month—the largest decline on record for any summer month (July, August, September) going all the way back through 1993.
Median Price July to August 2013: -0.9%
Median Price July to August 2014: -6.6%
Here’s your closed sales yearly comparison chart:
Sales took quite a dip month-over-month and saw their second-biggest year-over-year decline this year, but remain well above the post-bubble crash levels seen from 2008 through 2011.
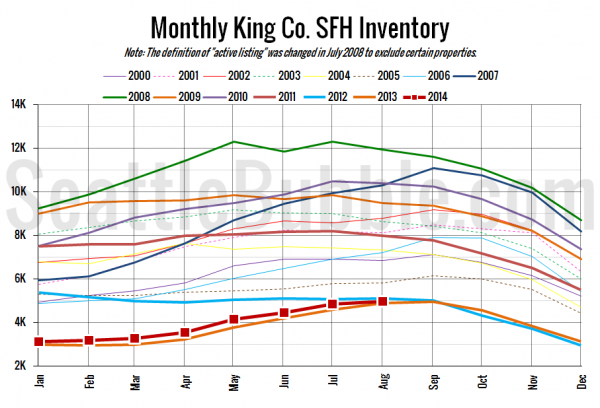
Here’s the graph of inventory with each year overlaid on the same chart.
Inventory inched up much more slowly in August than it had in the months prior.
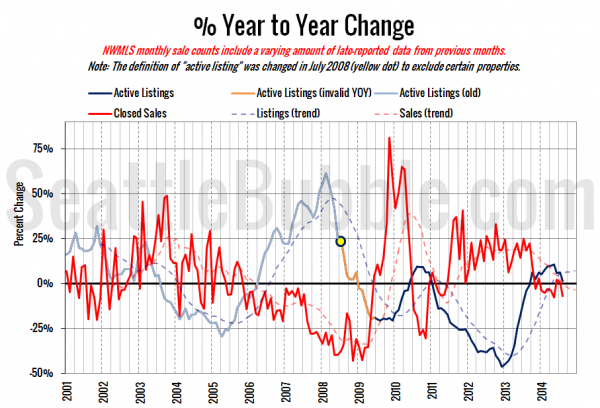
Here’s the supply/demand YOY graph. “Demand” in this chart is represented by closed sales, which have had a consistent definition throughout the decade (unlike pending sales from NWMLS).
Still moving ever so slightly toward buyers.
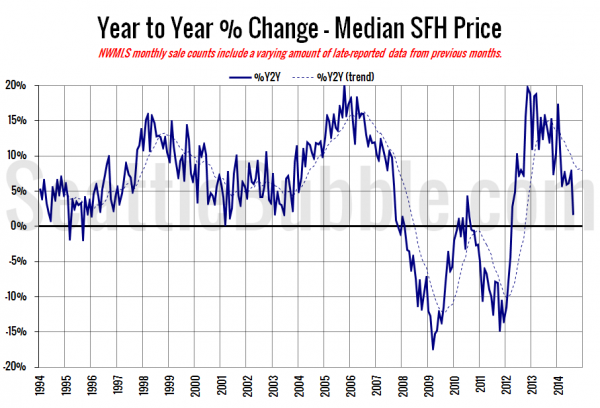
Here’s the median home price YOY change graph:
The year-over-year growth in median price fell to its lowest point since April 2012, which was the last month that prices were still down from a year earlier.
And lastly, here is the chart comparing King County SFH prices each month for every year back to 1994 (not adjusted for inflation).
August 2014: $437,000
November 2006: $435,000
Here are the articles from the Seattle Times and P-I:
Seattle Times: King Co. home prices in August up from year ago
Seattle P-I: Seattle house prices down from July’s record
Check back tomorrow for the full reporting roundup.

