September market stats were published by the NWMLS yesterday. Here’s a snippet from their press release: Home Sales Stay Strong but Prices Approaching "Affordability Ceiling" for Some Buyers.
Pending sales of homes around Western Washington surged more than 13 percent in September compared to a year ago, and listing activity picked up slightly, fueling both broker optimism and words of advice for sellers.
…
Commenting on September’s activity, industry veteran Gary O’Leyar said he expects the Greater Puget Sound real estate market will maintain a “healthy glow” in 2015 so long as there is no radical increase in interest rates. “I foresee a general leveling off in overall market activity as prices approach the affordability ceiling for many buyers,” remarked O’Leyar, the designated broker/owner of Prudential Signature Properties in Seattle.
“Healthy glow.” Good one. I’m going to have to remember that one.
Okay, let’s get on with our usual monthly stats.
NWMLS monthly reports include an undisclosed and varying number of
sales from previous months in their pending and closed sales statistics.
Here’s your King County SFH summary, with the arrows to show whether the year-over-year direction of each indicator is favorable or unfavorable news for buyers and sellers (green = favorable, red = unfavorable):
| September 2014 | Number | MOM | YOY | Buyers | Sellers |
|---|---|---|---|---|---|
| Active Listings | 4,958 | -0.2% | -0.1% |  |
 |
| Closed Sales | 2,113 | -11.4% | -4.0% |  |
 |
| SAAS (?) | 1.32 | -0.7% | +11.6% |  |
 |
| Pending Sales | 2,617 | -5.9% | +4.3% |  |
 |
| Months of Supply | 2.35 | +12.6% | +4.0% |  |
 |
| Median Price* | $460,000 | +5.3% | +9.5% |  |
 |
Feel free to download the updated Seattle Bubble Spreadsheet (Excel 2003 format), but keep in mind the caution above.
Not much going on this month. Prices shifted back up (probably just due to another shift in the geographic mix). Meanwhile sales and listings both began to dip in a typical fall fashion.
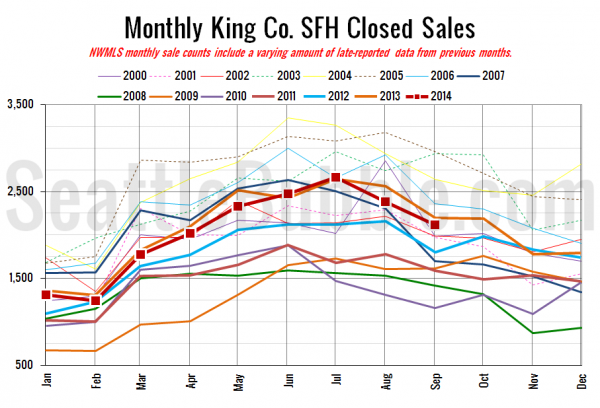
Here’s your closed sales yearly comparison chart:
After taking a big hit last month closed sales dipped even more between August and September, but the drop was fairly typical for this time of year. Between 2000 and 2013, sales fell an average of 12.2% between August and September, versus 11.4% this year.
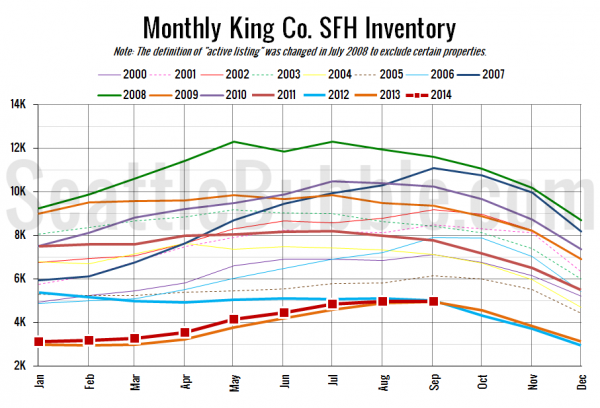
Here’s the graph of inventory with each year overlaid on the same chart.
Inventory began its annual slide with a very slight dip from last month.
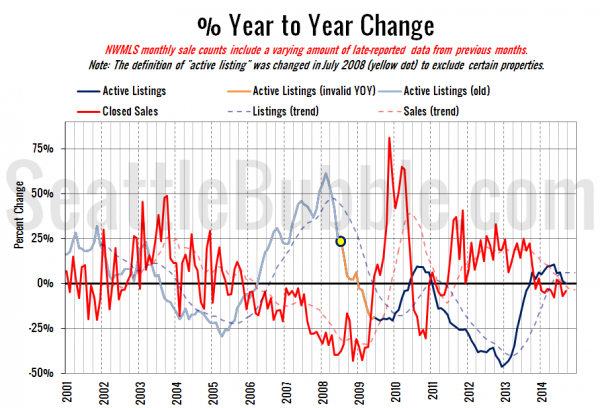
Here’s the supply/demand YOY graph. “Demand” in this chart is represented by closed sales, which have had a consistent definition throughout the decade (unlike pending sales from NWMLS).
Not much change on this one, though both lines did shift slightly closer to zero.
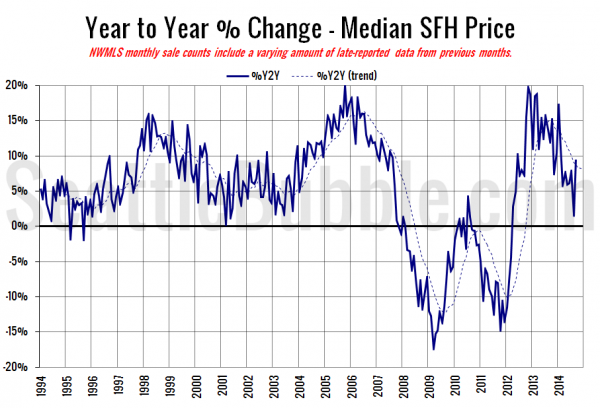
Here’s the median home price YOY change graph:
The year-over-year growth in median price bumped back up last month but fell just short of moving back into double-digit territory.
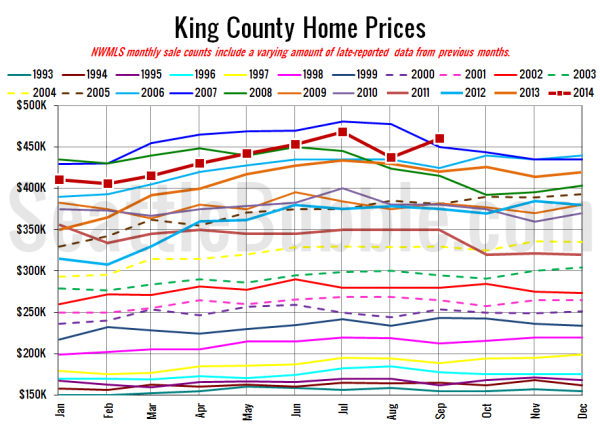
And lastly, here is the chart comparing King County SFH prices each month for every year back to 1994 (not adjusted for inflation).
Last month had the highest median price ever for a September.
September 2014: $460,000
April 2007: $465,000
Here are the articles from the Seattle Times and P-I:
Seattle Times: King County home prices resume their climb
Seattle P-I: Seattle-area home prices up again
Check back tomorrow for the full reporting roundup.

