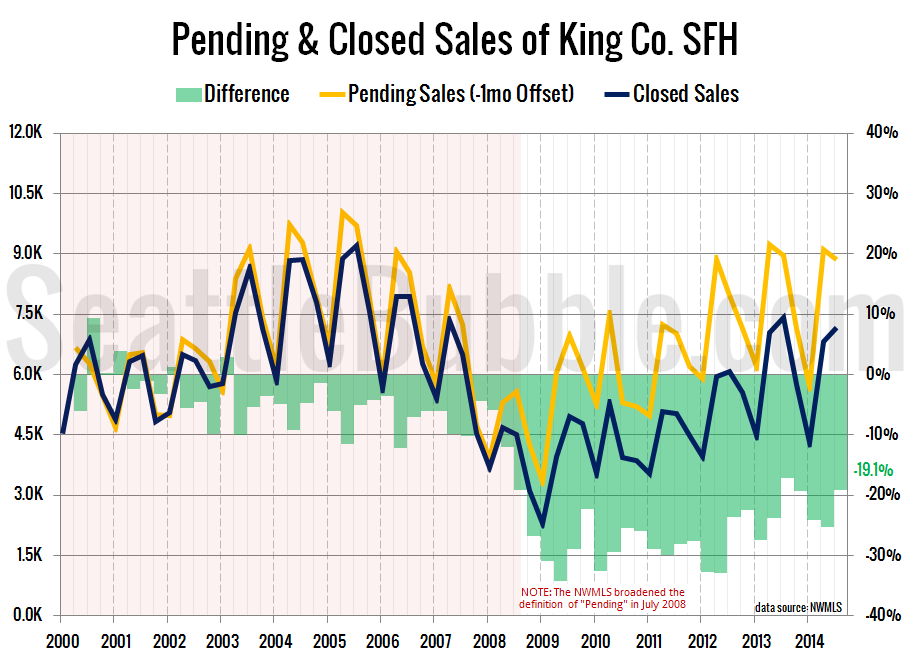
Let’s take a look a the latest data on pending sales volume versus closed sales volume.
For this series I roll the pending sales and closed sales data up by quarter, with pending sales offset by one month. In other words, the third quarter numbers below represent pending sales from June, July, and August and closed sales from July, August, and September.
As of the third quarter, just under one in five pending sales (19.1 percent) were still failing to ever show up in the closed sales numbers.
| Quarter | Avg. Diff |
|---|---|
| Q1 | -29.4% |
| Q2 | -29.2% |
| Q3 | -23.1% |
| Q4 | -24.0% |
This number is closer to zero than it has been the last few quarters, but it’s worth mentioning that there appears to be a slight seasonality to this statistic. The table at right shows the average difference between pending and closed sales (offset one month) by quarter since the NWMLS changed their definition of “pending” in July 2008.
The takeaway for sellers is that historically the third quarter has been the best time to sell your home if you want the best chance of the sale actually going through.

