November market stats were published by the NWMLS today. They haven’t published their press release to its typical location yet [update: it has been posted now], so let’s just dive right into our usual monthly stats.
NWMLS monthly reports include an undisclosed and varying number of
sales from previous months in their pending and closed sales statistics.
Here’s your King County SFH summary, with the arrows to show whether the year-over-year direction of each indicator is favorable or unfavorable news for buyers and sellers (green = favorable, red = unfavorable):
| November 2014 | Number | MOM | YOY | Buyers | Sellers |
|---|---|---|---|---|---|
| Active Listings | 3,658 | -18.8% | -4.2% |  |
 |
| Closed Sales | 1,870 | -16.4% | +5.4% | |
|
| SAAS (?) | 1.00 | -13.1% | -6.6% | |
|
| Pending Sales | 2,128 | -19.4% | +3.9% | |
|
| Months of Supply | 1.96 | -2.8% | -9.1% | |
|
| Median Price* | $440,000 | -1.6% | +6.3% | |
|
Feel free to download the updated Seattle Bubble Spreadsheet (Excel 2003 format), but keep in mind the caution above.
Up until this month there was still at least one category that was trending in buyers’ direction, but this month it’s all shifting toward a sellers’ market. This is quite the change from a year ago, when nearly every indicator was moving in buyers’ favor.
Closed sales slipped in November, in typical fashion for this time of year. Prices dipped back down a bit more, and listings continued to decrease as they do at this time every year, while staying below last year’s levels for the third month in a row.
Here’s your closed sales yearly comparison chart:

Closed sales fell 16 percent from the previous month, but came in 5 percent above last year’s level—the largest year-over-year gain since October of last year.
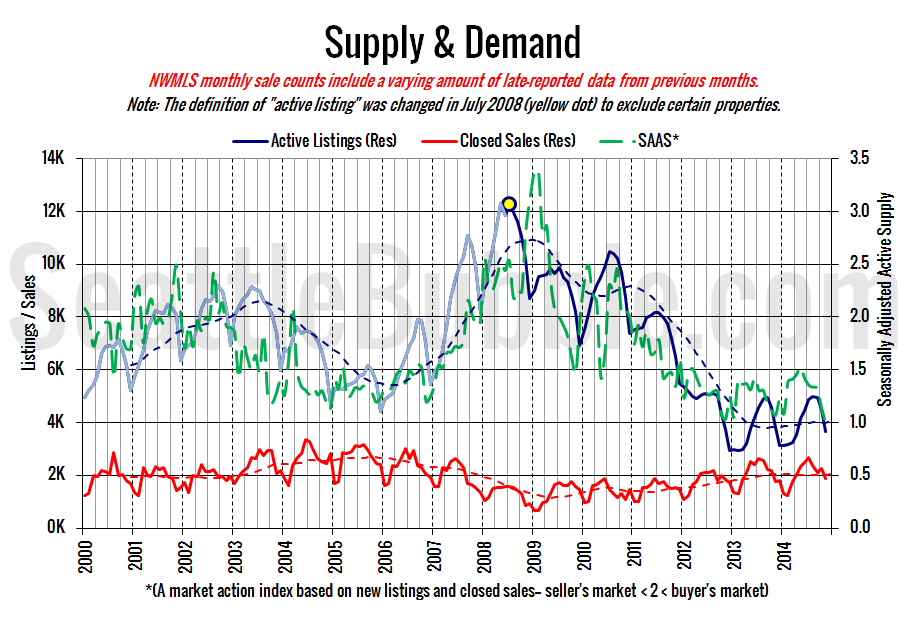
Here’s the graph of inventory with each year overlaid on the same chart.

Inventory continued its seasonal slide with the biggest month-over-month decrease since December of 2012.
Here’s the supply/demand YOY graph. “Demand” in this chart is represented by closed sales, which have had a consistent definition throughout the decade (unlike pending sales from NWMLS).

Both supply and demand are moving back in sellers’ favor, with increasing sales and decreasing listings.
Here’s the median home price YOY change graph:

Hovering around where it’s been for most of the year.
And lastly, here is the chart comparing King County SFH prices each month for every year back to 1994 (not adjusted for inflation).

Home prices have been basically flat since May.
November 2014: $440,000
October 2006: $440,000
I haven’t seen articles posted on the Seattle Times and P-I yet, but I’ll update this post when they’re published.
[update: here they are]
Seattle Times: King County median home price up 6.3 percent over year ago
Seattle P-I: Still few homes for sale, many buyers in Seattle area
Check back tomorrow for the full reporting roundup.