March market stats were published by the NWMLS yesterday. Before we get into our monthly stats, here’s a quick look at their press release.
Frenzied Market Frustrating Buyers
Buyer anxiety is rising as the pace of home sales is faster than brokers are able to replenish inventory, according to members of Northwest Multiple Listing Service. Figures just released for March show 11,408 pending sales during the month while only 10,505 sellers listed their homes for sale during the same period.
“The frenzy market has returned and is in full bloom in King and Snohomish counties. Listings are selling as soon as they come on the market for sale,” said J. Lennox Scott, chairman and CEO of John L. Scott Real Estate.
…
This market is pushing buyers beyond their comfort level, suggested Northwest MLS director Frank Wilson, the branch managing broker at John L. Scott, Inc. Poulsbo. “They’re being asked to write offers faster, for more money and with less help from the seller and the result is stress. Multiple offers only add to their stress.”
Some of the agents quoted in the release actually sound concerned for buyers, which is quite a different tone than the jubilant rah-rah releases we saw during the last housing bubble. Lennox Scott still sounds pumped up, though.
NWMLS monthly reports include an undisclosed and varying number of
sales from previous months in their pending and closed sales statistics.
Here’s your King County SFH summary, with the arrows to show whether the year-over-year direction of each indicator is favorable or unfavorable news for buyers and sellers (green = favorable, red = unfavorable):
| March 2014 | Number | MOM | YOY | Buyers | Sellers |
|---|---|---|---|---|---|
| Active Listings | 2,737 | +0.6% | -16.0% |  |
 |
| Closed Sales | 2,091 | +51.2% | +18.0% |  |
 |
| SAAS (?) | 1.31 | -3.8% | -7.3% |  |
 |
| Pending Sales | 3,231 | +30.0% | +16.1% |  |
 |
| Months of Supply | 1.31 | -33.5% | -28.8% |  |
 |
| Median Price* | $440,250 | +2.4% | +6.1% |  |
 |
Feel free to download the updated Seattle Bubble Spreadsheet (Excel 2003 format), but keep in mind the caution above.
Unfortunately for buyers, there’s still no good news on supply. Inventory is pitiful and shows no glimmer of getting any better soon. With inventory as low as it is and interest rates still so low, I’m actually surprised home prices are only up six percent from a year ago.
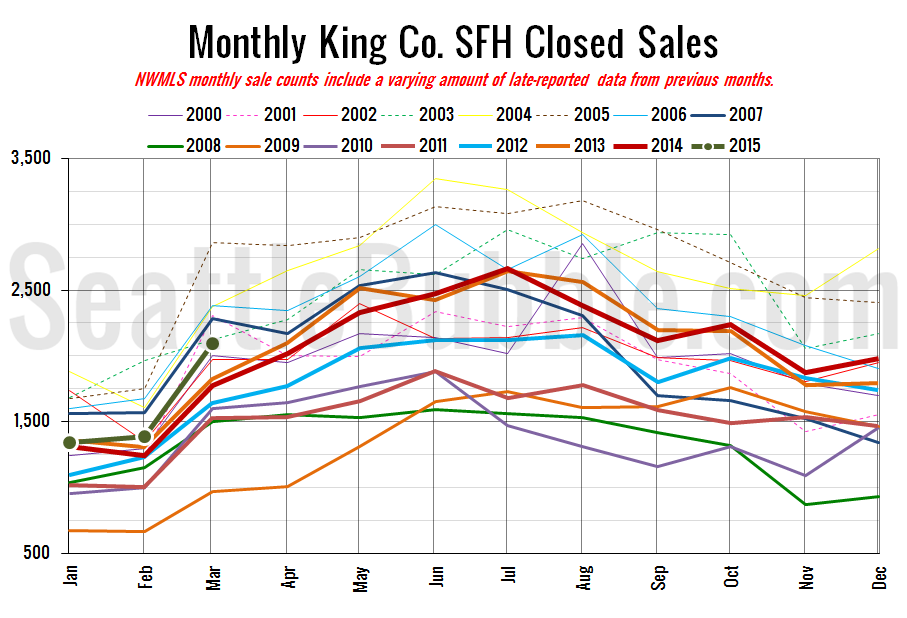
Here’s your closed sales yearly comparison chart:
Closed sales rose 51 percent from February to March. Last year they rose 43 percent over the same period.
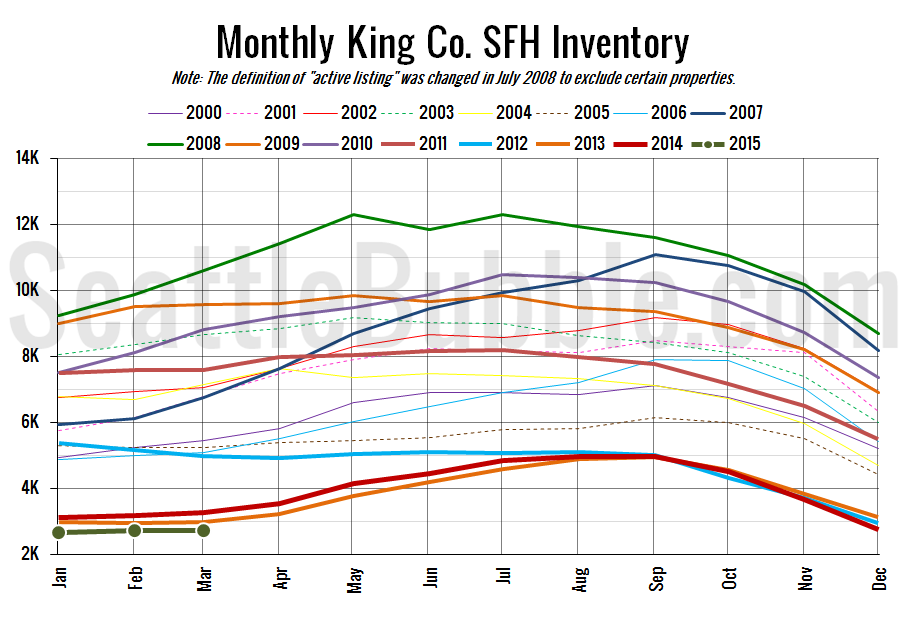
Here’s the graph of inventory with each year overlaid on the same chart.
Inventory barely creeped up from February to March. Year-over-year inventory fell to its lowest point since June 2013.
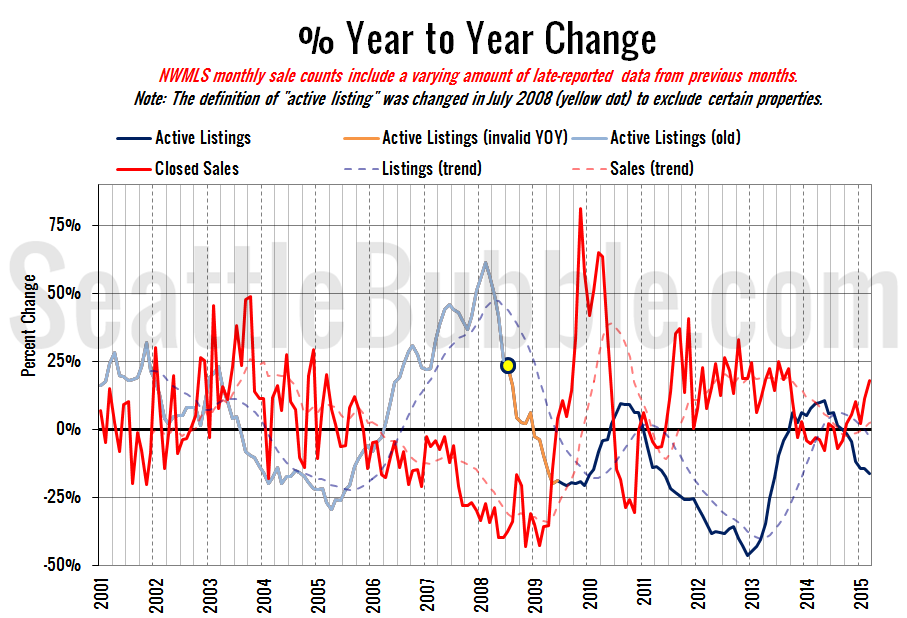
Here’s the supply/demand YOY graph. “Demand” in this chart is represented by closed sales, which have had a consistent definition throughout the decade (unlike pending sales from NWMLS).
Both supply and demand continued to move further in sellers’ favor in March.
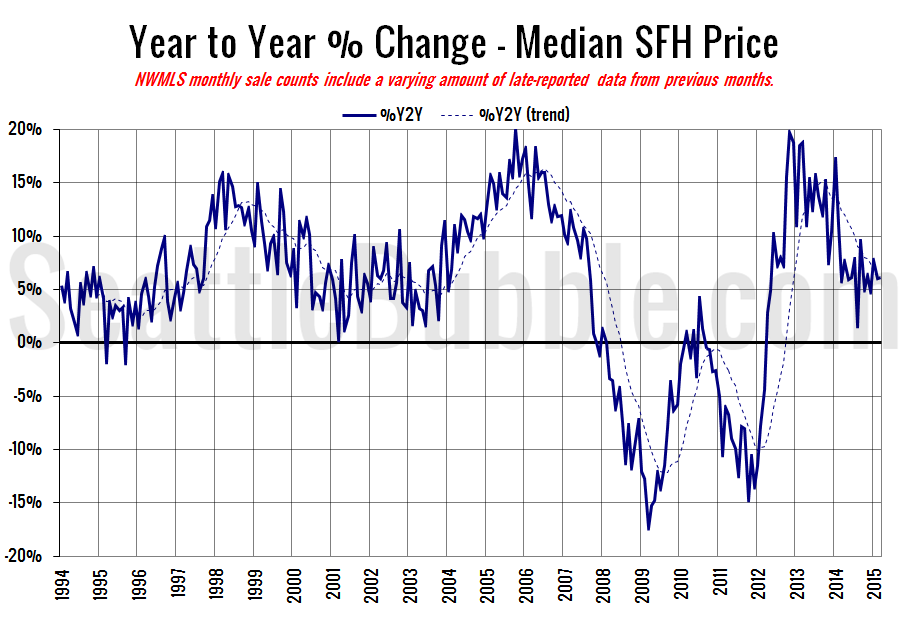
Here’s the median home price YOY change graph:
Like I said, I’m frankly shocked that this chart isn’t in the double digits.
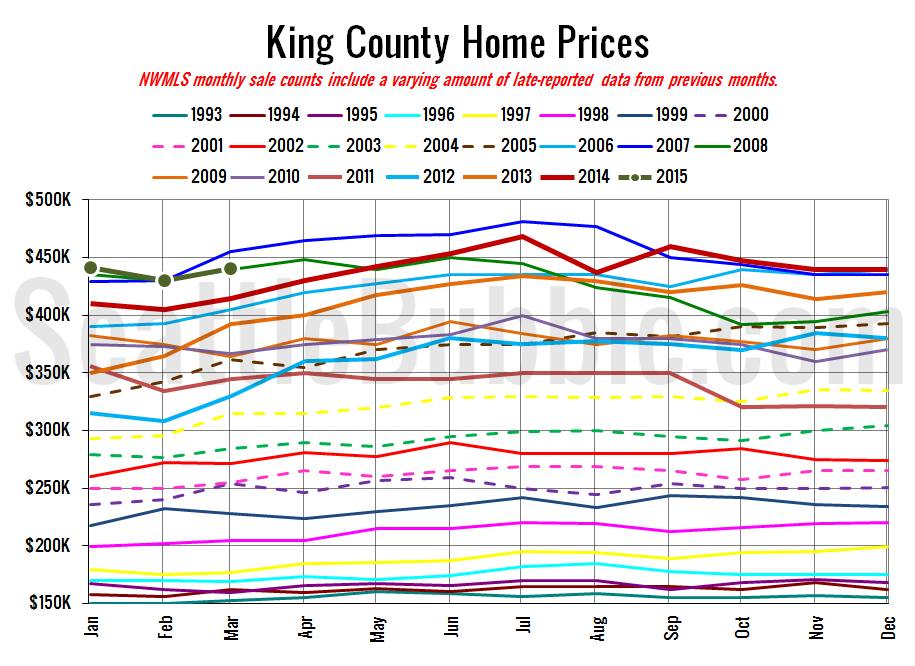
And lastly, here is the chart comparing King County SFH prices each month for every year back to 1994 (not adjusted for inflation).
Home prices are floating along only a little lower than the peak year in 2007. Of course these values are not adjusted for inflation, so in real terms we’re not as close to the peak as it appears.
February 2015: $440,250
October 2006: $440,000
Here’s this month’s article from the Seattle Times. Aubrey Cohen has finally moved on from his long stint as the real estate reporter at the Seattle P-I, so I don’t expect to see any more real estate news coverage from them. The topic just isn’t click-baity enough for their current business model.
Seattle Times: Home prices in Seattle jump 18.9 percent from year ago
Check back tomorrow for the full reporting roundup.

