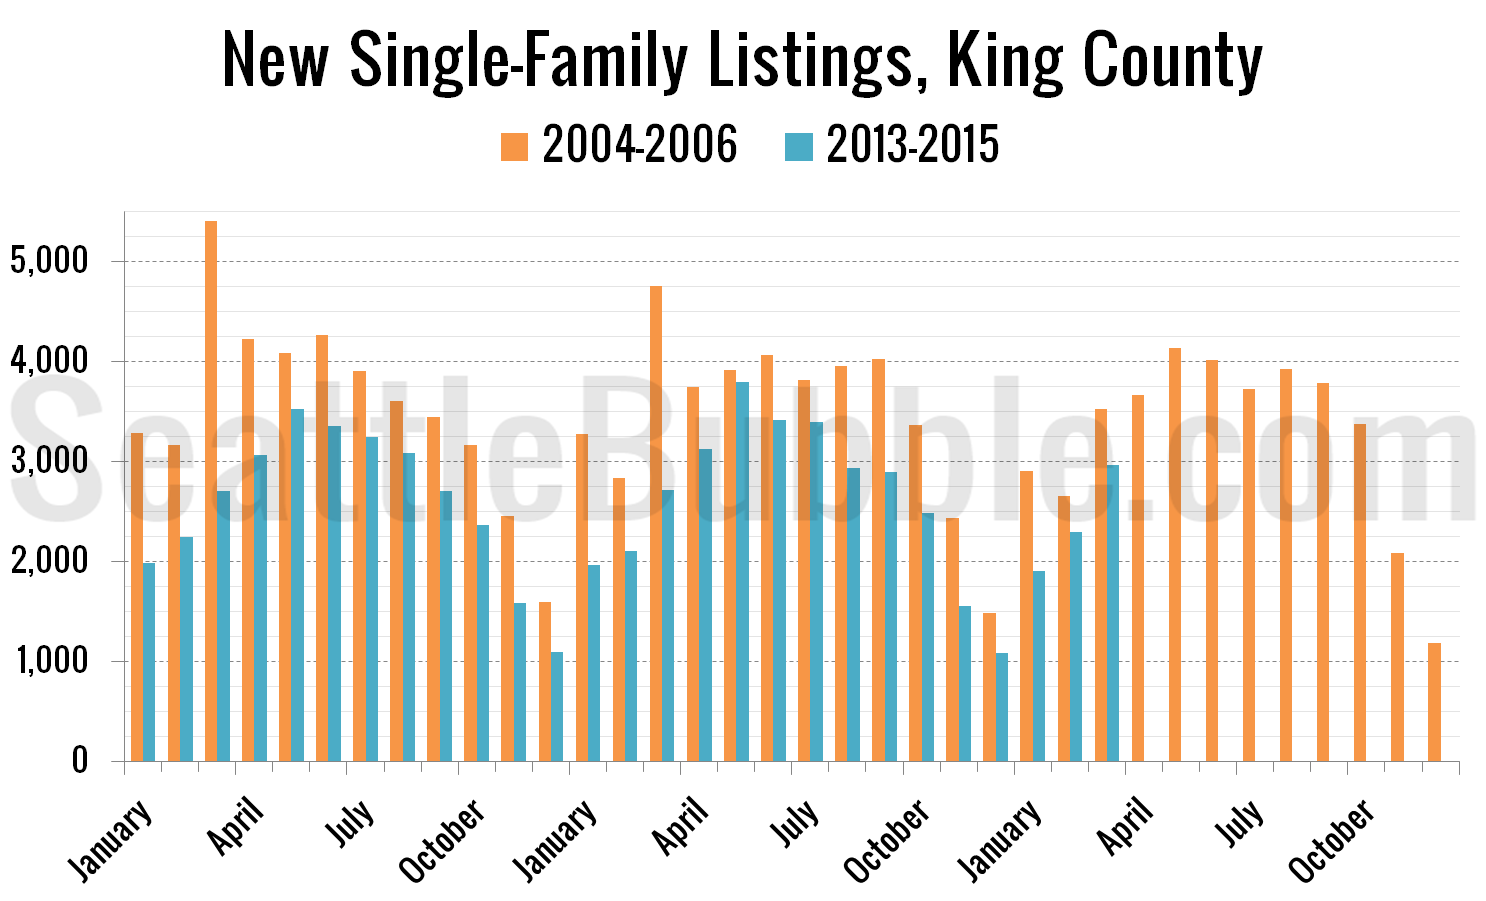
I thought it would be interesting to take a deeper look at the depth of the current listings drought by comparing monthly new listings over the last few years to the same period during the previous bubble (before listings began to increase in 2007).
Here’s a view of the number of new single-family homes that were listed each month from 2013 through the present compared with the same month in the 2004-2006 timeframe:
Over the past 27 months, 25 percent fewer single-family homes have been listed than during the same months in the 2004 to 2006 period. Considering how tight the market was during the previous housing bubble, imagining it today with 25 percent fewer homes hitting the market each month is just nuts.
However, that’s only half of the picture. Let’s look at the other side of the supply and demand equation: closed sales.
Over the same period there have been an average of 22 percent fewer closed sales of single-family homes. This could be because there is still a lot less enthusiasm about homebuying today than there was at the height of the last housing bubble between 2004 and 2006, or it could be a direct consequence of the lower listing volume.
Either way, it’s clear that if we want to get anywhere close to a reasonable, non-bubbly market, we’re going to need a lot more listings.


