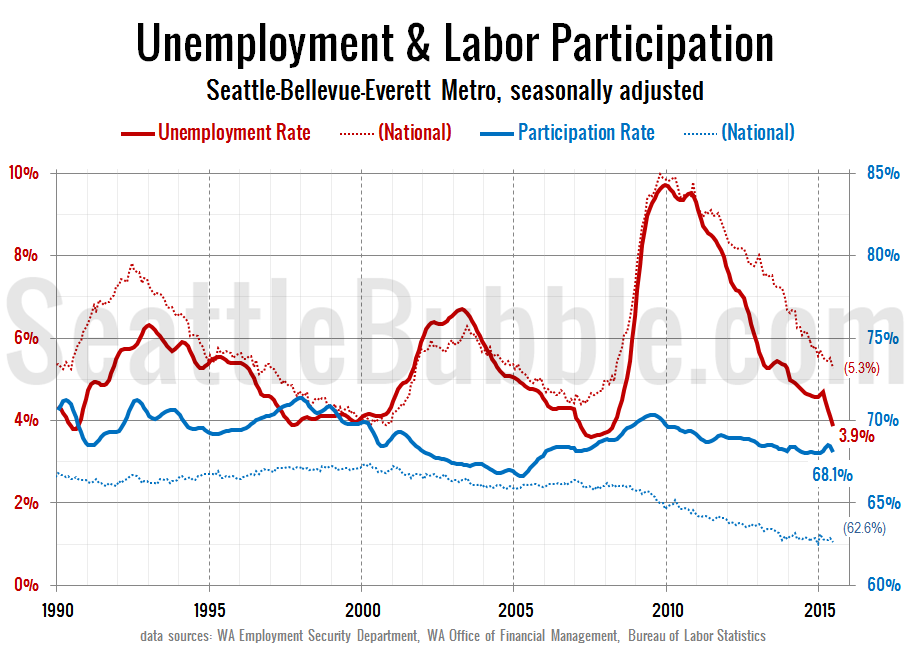
We haven’t taken a look at the jobs data in a while, so lets update those charts through June. In this series we look at how the Seattle area’s unemployment rate and approximate labor participation rate stack up to the national numbers.
[July 24 Update – The chart above and numbers below have been updated to reflect Seattle-area participation rates using total OFM population counts for ages 15 and up. Note that the BLS population counts for labor participation are for the “civilian noninstitution” population ages 16 and up, so the national and local numbers are not perfectly comparable.]
In June the Seattle-Bellevue-Everett metro area saw the unemployment rate fall below 4 percent for the first time since April 2008. The national level of 5.3 percent was also roughly on-par with where it was at in early 2008.
The Seattle-area labor participation rate* keeps bouncing around the 68 to 69 percent range that it has been at since 2010. The national labor force participation rate continues to bump along in the same area it has been since early 2014 at around 62 percent.
For reference, in 2006 when everyone imagined the economy to be in great health, the local unemployment rate averaged 4.3% and the labor participation rate averaged 68.3%. In other words, in terms of employment and participation, the Seattle area economy is currently in comparable shape to where it was at the peak of the last boom.
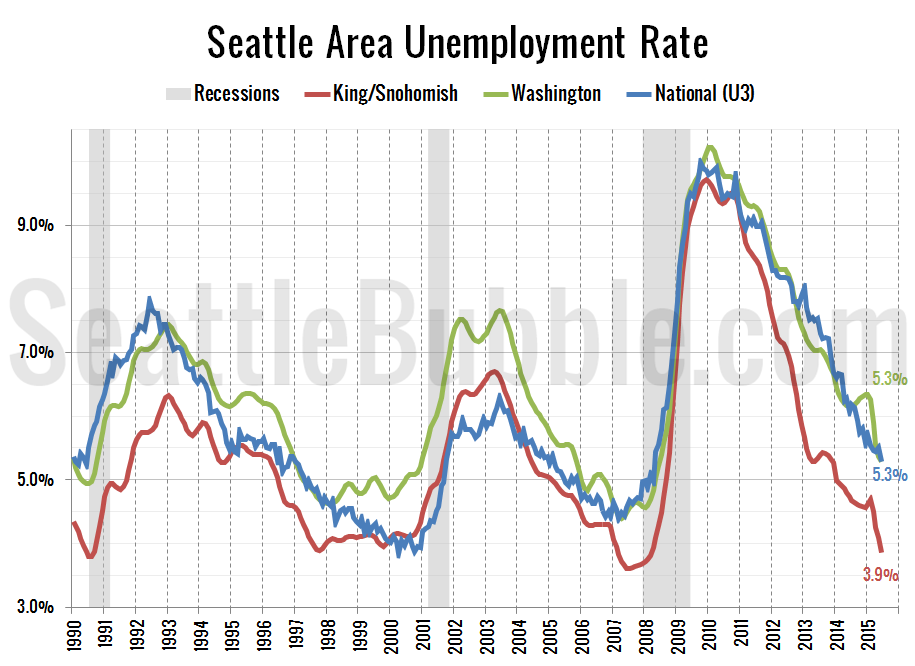
Here’s a look at the local and national unemployment rates with Washington’s statewide rate thrown in as well.
Washington as a whole has the same unemployment rate as the nation at 5.3 percent.
Sources:
- Seattle Unemployment: Washington State Employment Security Department
- US Unemployment: Bureau of Labor Statistics
Seasonally adjusted series used for all data sets.
*Note: Posts in this series prior to 2015 overstated the Seattle-area labor participation rate due to an incomplete population count in my calculations. This has been corrected in the historic data above.

