Get access to the full spreadsheets used to make the charts in this and other posts, and support the ongoing work on this site by becoming a member of Seattle Bubble.
We haven’t updated our monthly stats for the local regions outside of the King/Snohomish core since last year, so let’s have a look. Here’s your March update to our “Around the Sound” statistics for Pierce, Kitsap, Thurston, Island, Skagit, and Whatcom counties.
How is the market doing outside of the central King County area? Not much different, really. Listings are super-scarce, demand is reasonably strong, and prices keep going up.
First up, a summary table:
| March 2016 | King | Snohomish | Pierce | Kitsap | Thurston | Island | Skagit | Whatcom |
|---|---|---|---|---|---|---|---|---|
| Median Price | $531,250 | $385,000 | $265,000 | $279,475 | $239,900 | $305,000 | $277,000 | $303,000 |
| Price YOY | 20.7% | 13.2% | 8.2% | 16.3% | 4.8% | 24.5% | 12.1% | 12.2% |
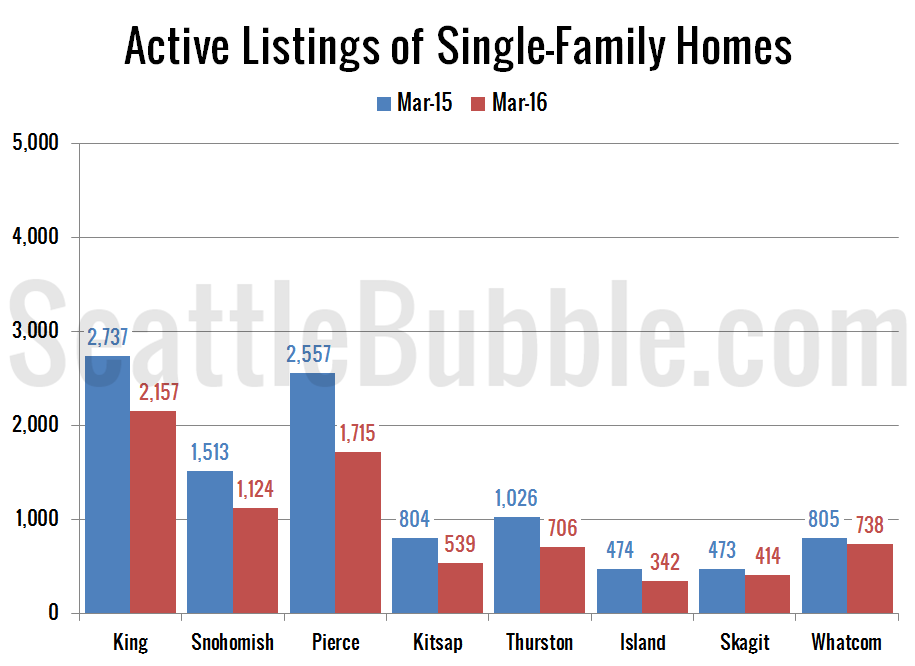
| Active Listings | 2,157 | 1,124 | 1,715 | 539 | 706 | 342 | 414 | 738 |
| Listings YOY | -21.2% | -25.7% | -32.9% | -33.0% | -31.2% | -27.8% | -12.5% | -8.3% |
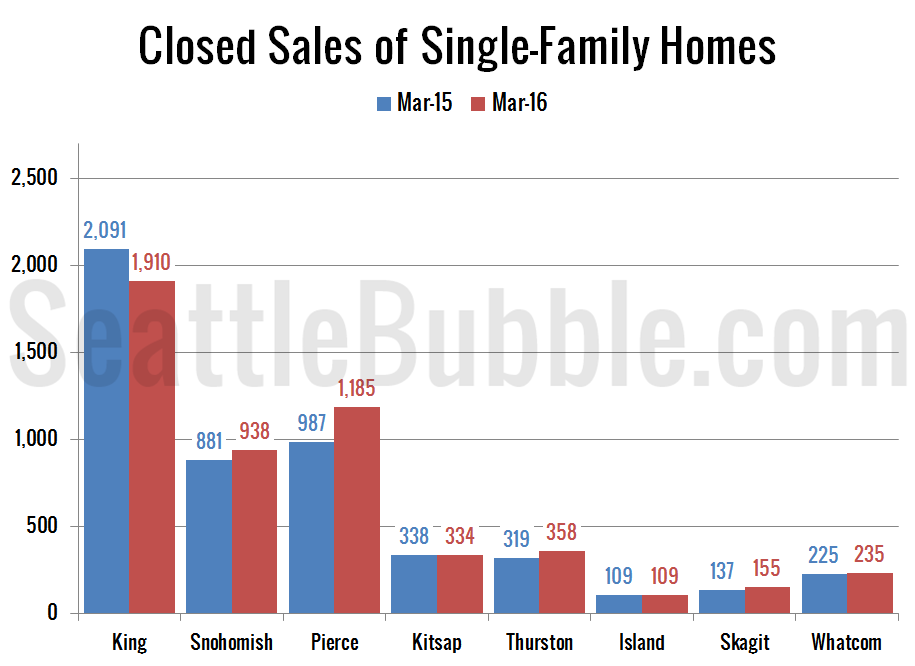
| Closed Sales | 1,910 | 938 | 1,185 | 334 | 358 | 109 | 155 | 235 |
| Sales YOY | -8.7% | 6.5% | 20.1% | -1.2% | 12.2% | 0.0% | 13.1% | 4.4% |
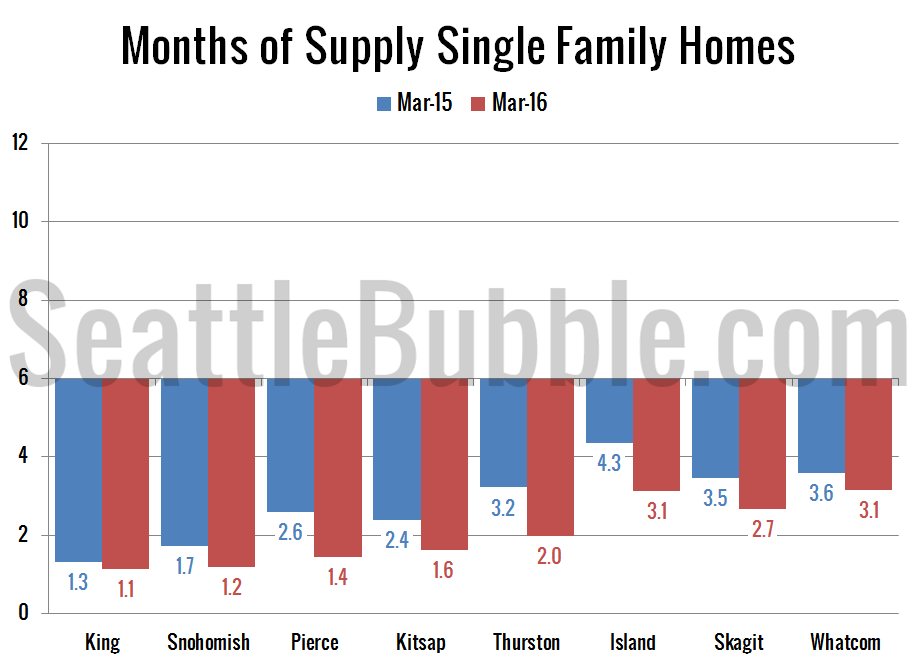
| Months of Supply | 1.1 | 1.2 | 1.4 | 1.6 | 2.0 | 3.1 | 2.7 | 3.1 |
It’s very interesting that Pierce County had the second-smallest price gains in March despite having a massive decrease in inventory and a big spike in closed sales as well. Usually with demand spiking and supply falling that hard I would expect to see a bigger price surge.
Median home prices were up in every single county from a year earlier. King County’s 21 percent increase was actually the second-largest, beat out by a whopping 24 percent increase in Island County. The smallest year-over-year price increase in March was in Thurston, which was up 5 percent.
Listings are down dramatically from a year ago in every county as well. The biggest dips were in Kitsap and Pierce Counties, which were both down by 33 percent from a year earlier. Only Whatcom county saw a single-digit drop, down “just” 8 percent.
Closed sales were actually flat or up from a year ago in every single county except King County in March. The biggest gains were in Pierce County, which saw closed sales increase 20 percent from a year ago. Skagit and Thurston also had big gains at 13 percent and 12 percent, respectively.
Months of supply is bleak for buyers everywhere. Every single county had fewer months of supply this March than it did a year ago, and they’re all deep in seller’s market territory.
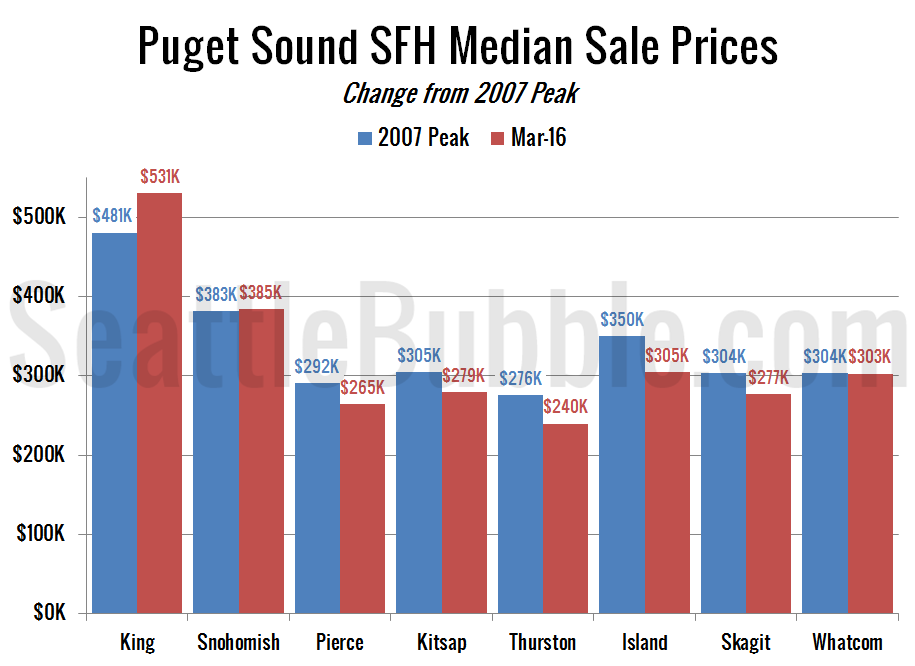
Finally, here’s a chart comparing the median price in March to the 2007 peak price in each county. In March Snohomish County joined King County in the “above the 2007 peak” club. The other counties are still below their previous peak by anywhere from less than half a percent in Whatcom County to as much as 13 percent in Thurston and Island Counties.
In summary: It’s a terrible time to be a home buyer, pretty much no matter where you’re looking in the Greater Seattle Area. King County is arguably the worst, but the picture doesn’t get much better in the surrounding counties.
If there is certain data you would like to see or ways you would like to see the data presented differently, drop a comment below and let me know.


