Get access to the full spreadsheets used to make the charts in this and other posts, as well as a variety of additional insider benefits by becoming a member of Seattle Bubble.
April market stats were published by the NWMLS yesterday. Before we get into our monthly stats, here’s a quick look at their press release.
Housing inventory improves, but market still favors sellers
Northwest Multiple Listing Service reported strong gains in the volume of new listings its members added during April (up 13.6 percent from March), but inventory remained well below the supply needed for a more balanced market. MLS leaders say the lopsided market is prompting some anxious buyers to take ill-advised risks.
…
J. Lennox Scott, chairman and CEO of John L. Scott, Inc. described April as “another grand slam month for housing,” adding, “The market is more intense than a year ago. We are still seeing 80 percent of the homes coming on the market sell within the first 30 days.”Scott said “virtually all new listings are selling, many with multiple offers in all the market areas in King, Snohomish, Pierce and Kitsap counties in the price ranges where 90 percent of the sales activity is happening.” Heavy open house traffic and multiple offer situations are keeping brokers extremely busy, he added.
Gotta love that immeasurable “open house traffic” that they always love to quote. Seriously though, Lennox. Settle down just a little.
NWMLS monthly reports include an undisclosed and varying number of
sales from previous months in their pending and closed sales statistics.
Here’s your King County SFH summary, with the arrows to show whether the year-over-year direction of each indicator is favorable or unfavorable news for buyers and sellers (green = favorable, red = unfavorable):
| April 2016 | Number | MOM | YOY | Buyers | Sellers |
|---|---|---|---|---|---|
| Active Listings | 2,600 | +20.5% | -13.4% |  |
 |
| Closed Sales | 2,153 | +12.7% | -8.5% |  |
 |
| SAAS (?) | 1.45 | +1.1% | +5.7% |  |
 |
| Pending Sales | 3,031 | +5.4% | -11.1% |  |
 |
| Months of Supply | 1.21 | +6.9% | -5.4% |  |
 |
| Median Price* | $540,000 | +1.6% | +12.5% |  |
 |
Indeed, the market is still tilted strongly toward sellers, but for the last few months the supply and demand trends have been inching back toward a more favorable market for buyers. Inventory saw another uptick in April, and the year-over-year drop shrunk significantly again from -21 percent in March to -13 percent in April. Sales also continued to slow as both pending and closed sales are down around ten percent from a year ago for the second month in a row.
That said, the median price still rose to another new high. Remember though that before the last bubble burst, sales were declining for nearly two years and inventory was climbing for about a year before home prices finally started to decline as well. So even if we are at a turning point right now, don’t expect price gains to go away this year.
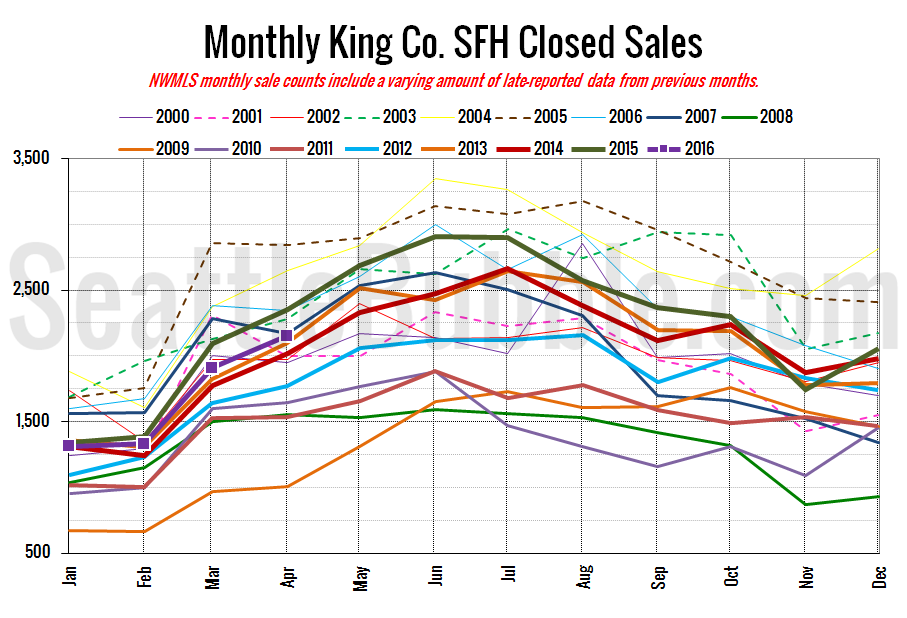
Here’s your closed sales yearly comparison chart:
Closed sales were up from February, by about the same amount as last year. The year-over-year drop in closed sales was about the same as last month.
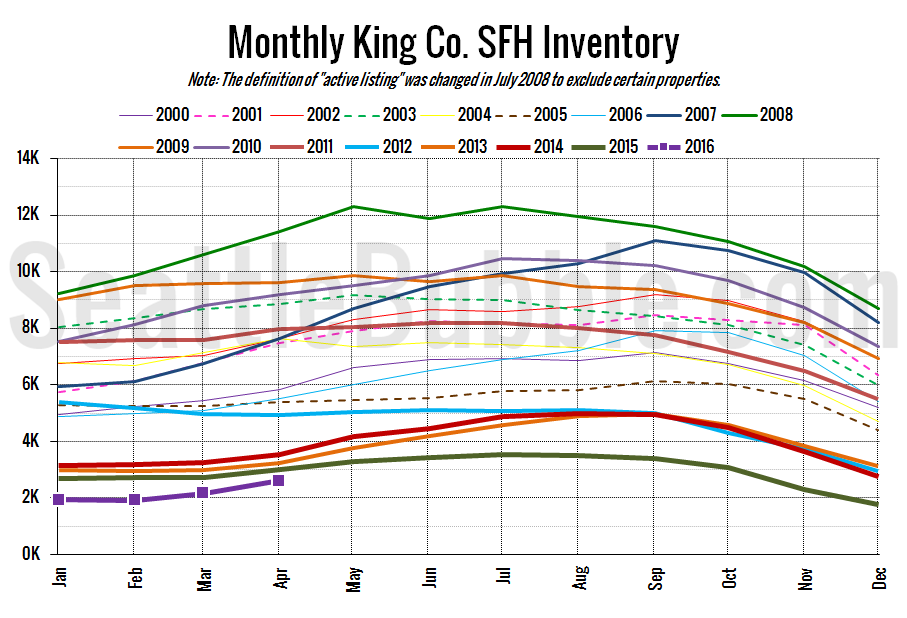
Here’s the graph of inventory with each year overlaid on the same chart.
Total inventory is at its lowest April level on record. On the flip side, the 20 percent month-over-month increase in on-market inventory is the largest gain on record.
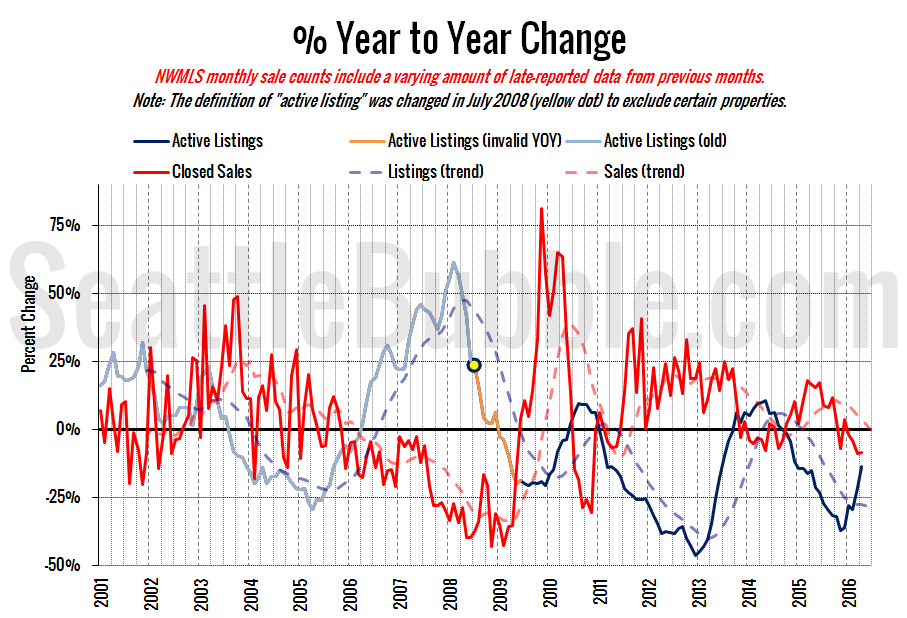
Here’s the supply/demand YOY graph. “Demand” in this chart is represented by closed sales, which have had a consistent definition throughout the decade (unlike pending sales from NWMLS).
The blue demand line is shooting back toward buyer’s market territory, but we’ve had false starts before in 2013 and 2010 with similar trends. It will be a while before we will be able to tell if this is more than just another slight blip.
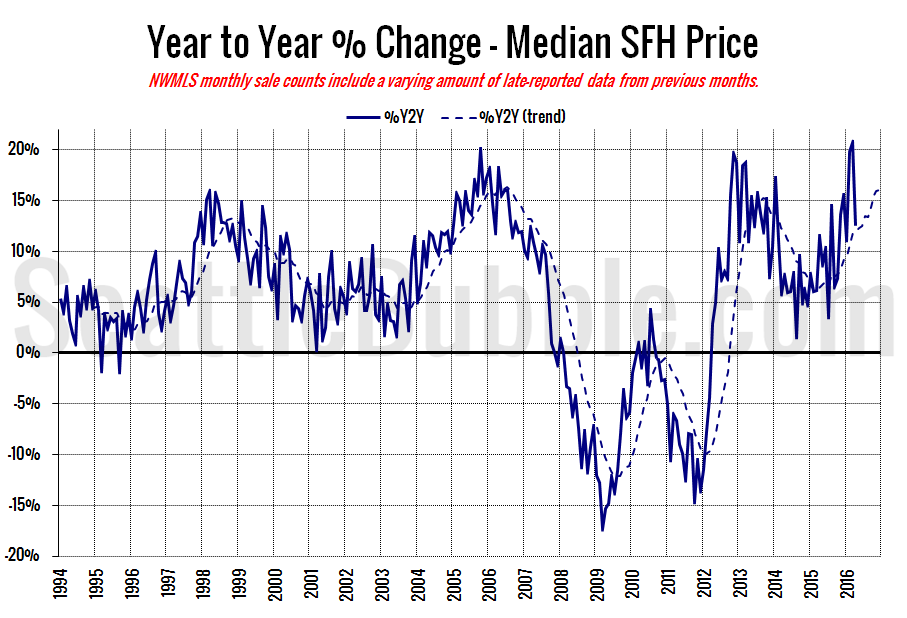
Here’s the median home price YOY change graph:
Year-over-year price growth dipped from a record-breaking 21 percent in March to a less ridiculous but still pretty absurd 13 percent in April.
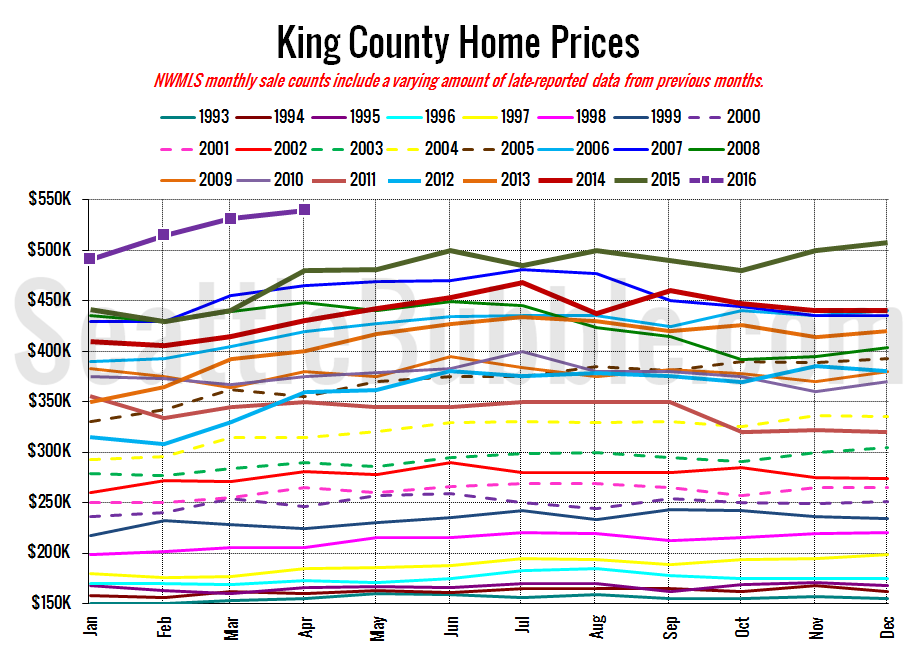
And lastly, here is the chart comparing King County SFH prices each month for every year back to 1994 (not adjusted for inflation).
Once again there has never been a better time to sell your home.
April 2016: $540,000
July 2007: $481,000 (previous cycle high)
Here’s this month’s article from the Seattle Times: Home prices charge ahead, driving some buyers farther afield

