Get access to the full spreadsheets used to make the charts in this and other posts, as well as a variety of additional insider benefits by becoming a member of Seattle Bubble.
May market stats were published by the NWMLS yesterday. Before we get into our monthly stats, here’s a quick look at their press release.
Housing inventory shortages persist
Just as expected, the month of May had an uptick in new listings (12,272), but just as many buyers (12,275) made offers on homes during the month to keep inventory depleted, according to the latest figures from Northwest Multiple Listing Service.“Inventory is being squeezed from all directions,” reported Frank Wilson, branch managing broker at John L. Scott in Poulsbo. He said the pool of house-hunters includes young first-time buyers, renters whose rents are escalating, buyers who are returning to the market after recovering from a foreclosure or short sale, investors, and baby boomers who are purchasing for their retirement needs.
…
“The May housing market was not just hot, it was frenzy hot,” commented J. Lennox Scott, chairman and CEO of John L. Scott Real Estate. “Brokers are working like bees in a hive as the housing market creates a buzz of sales activity in the Seattle-Central Puget Sound area.” By his analysis, 80 percent of the homes coming on the market in King and Snohomish counties are selling within the first 30 days. “Many sell within the first week,” Scott reported, adding, “A healthy/normal market would have 30 percent selling in the first 30 days.”
Interesting. So if you parse what Lennox is saying here… he is admitting that this market is not healthy.
NWMLS monthly reports include an undisclosed and varying number of
sales from previous months in their pending and closed sales statistics.
Here’s your King County SFH summary, with the arrows to show whether the year-over-year direction of each indicator is favorable or unfavorable news for buyers and sellers (green = favorable, red = unfavorable):
| May 2016 | Number | MOM | YOY | Buyers | Sellers |
|---|---|---|---|---|---|
| Active Listings | 2,696 | +3.7% | -17.8% |  |
 |
| Closed Sales | 2,509 | +16.5% | -6.5% |  |
 |
| SAAS (?) | 1.28 | -11.3% | +5.9% |  |
 |
| Pending Sales | 3,500 | +15.5% | +1.5% |  |
 |
| Months of Supply | 1.07 | -11.0% | -12.1% |  |
 |
| Median Price* | $560,000 | +3.7% | +16.4% |  |
 |
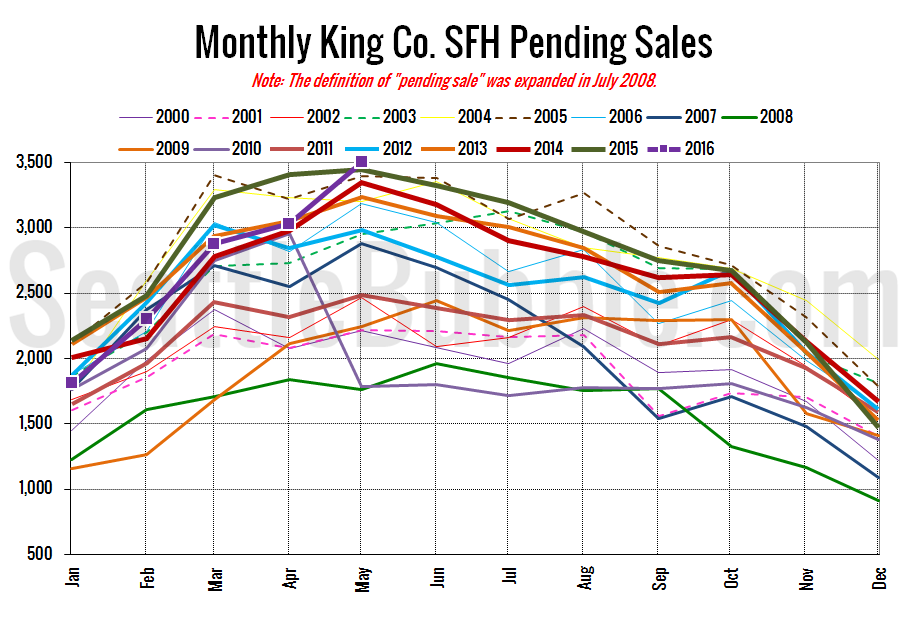
Pending sales of single-family homes in King County hit an all-time high in May. This does not bode well for buyers hoping for any sort of relief from stiff competition and fast-rising prices. Inventory did increase month-over-month, but barely.
The current market is the best time we’ve ever seen to sell a home, and conversely one of the worst times ever to buy a home. The only positive for buyers in this market is low interest rates.
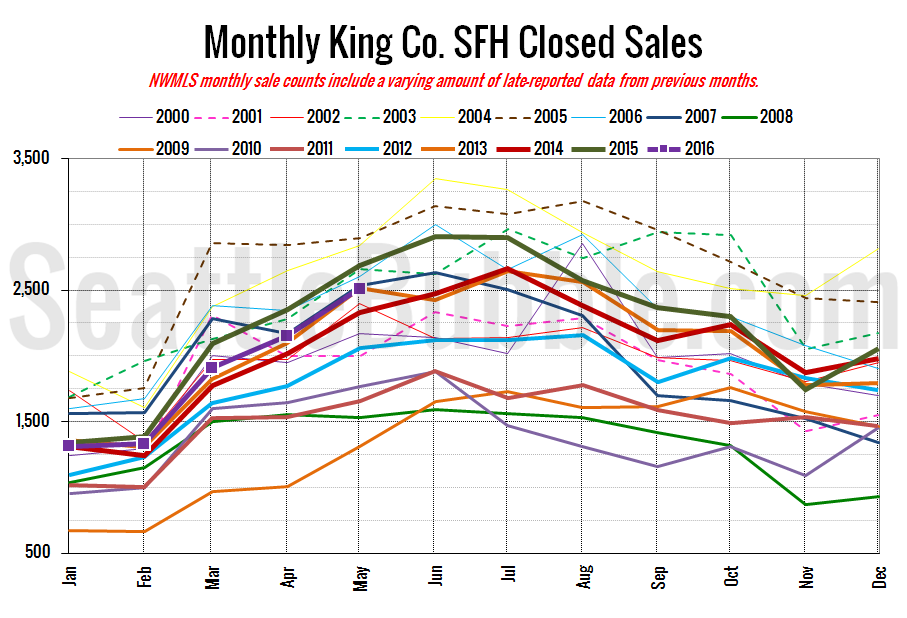
Here’s your closed sales yearly comparison chart:
Closed climbed at a fairly normal rate in May, and came in as one of the better years, but still not as high as 2003-2007.
Pending sales hit an all-time high in May, but comparing the current pending sales data to anything prior to July 2008 is somewhat deceptive, since the NWMLS changed their defintion of what they consider to be “active” and “pending” that month.
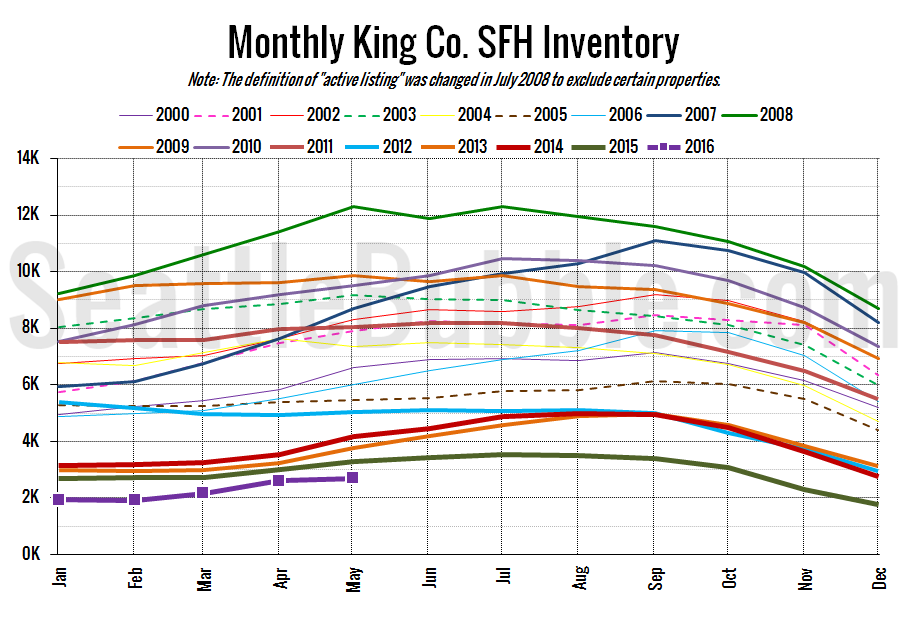
Here’s the graph of inventory with each year overlaid on the same chart.
Total inventory is at its lowest May level on record. After turning in reasonably strong month-over-month gains earlier this year, May was much weaker despite an increase in new listings. The big spike in pending sales no doubt contributed to this, taking many of those new listings off the market very quickly.
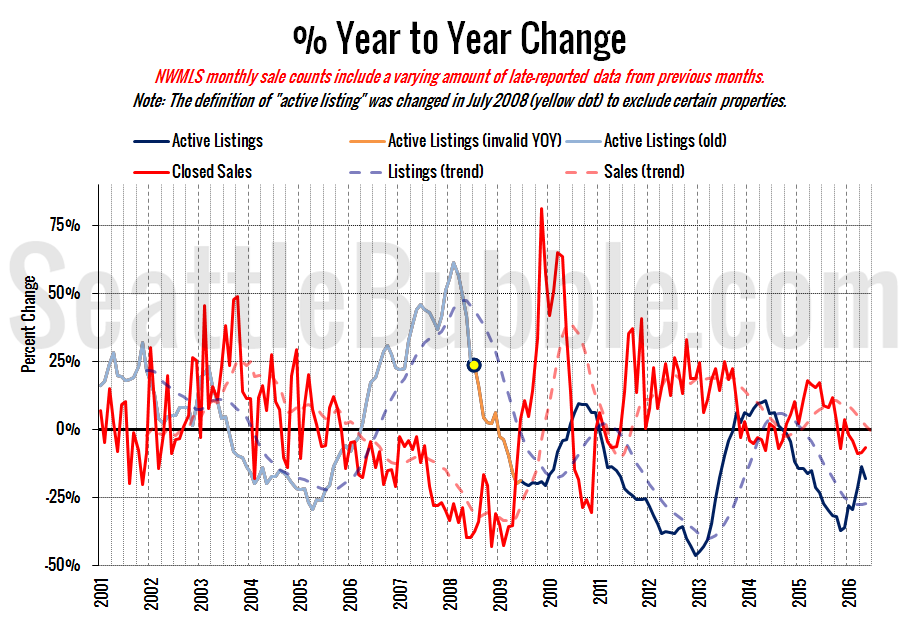
Here’s the supply/demand YOY graph. “Demand” in this chart is represented by closed sales, which have had a consistent definition throughout the decade (unlike pending sales from NWMLS).
The blue supply line turned back, going deeper into seller’s market territory. Demand as measured by closed sales is still shrinking slightly year-over-year, which is just about the only glimmer of hope for buyers in this market.
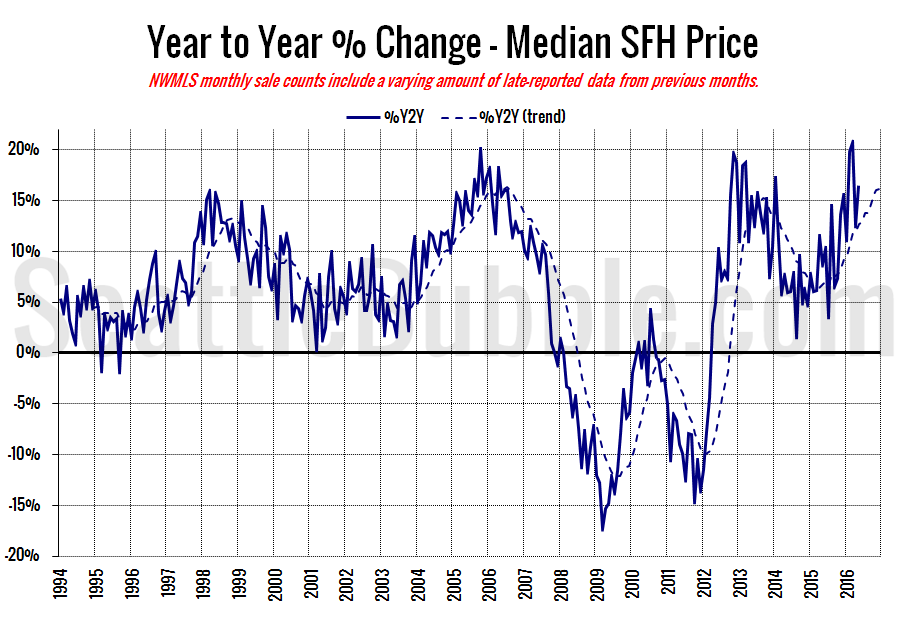
Here’s the median home price YOY change graph:
Year-over-year price growth shot up again, from 13 percent in April to 16 percent in May.
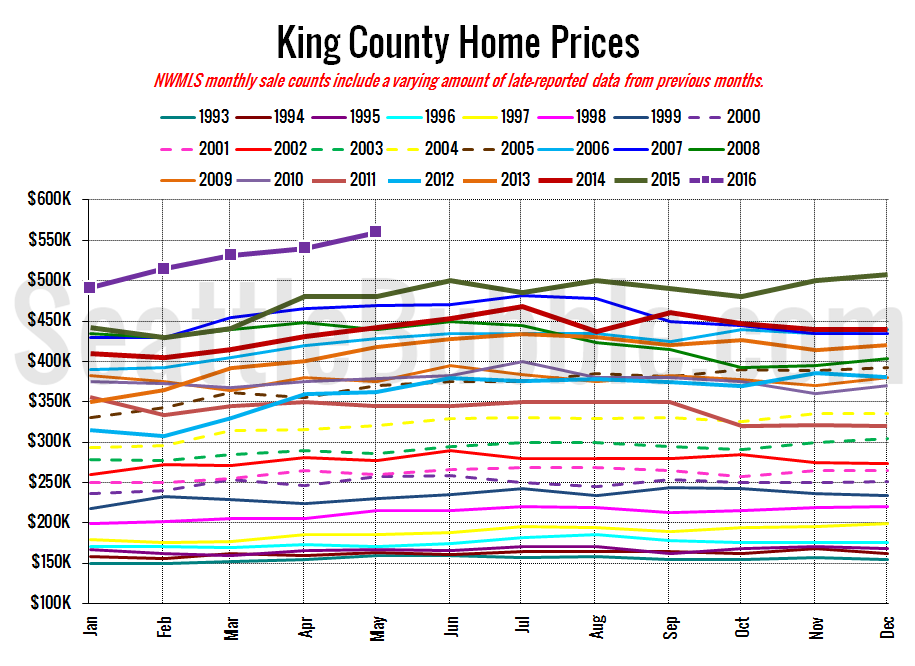
And lastly, here is the chart comparing King County SFH prices each month for every year back to 1994 (not adjusted for inflation).
Pretty much every month this year, it’s been a true statement that there has never been a better time to sell your home.
May 2016: $560,000
July 2007: $481,000 (previous cycle high)
Here’s this month’s article from the Seattle Times: Home prices soar again; some buyers camp out to lay claim to a future condo
Check back tomorrow for the full reporting roundup.
