Get access to the full spreadsheets used to make the charts in this and other posts, and support the ongoing work on this site by becoming a member of Seattle Bubble.
Let’s have a look at our housing stats for the broader Puget Sound area. Here’s your July update to our “Around the Sound” statistics for King, Snohomish, Pierce, Kitsap, Thurston, Island, Skagit, and Whatcom counties.
First up, a summary table:
| July 2016 | King | Snohomish | Pierce | Kitsap | Thurston | Island | Skagit | Whatcom |
|---|---|---|---|---|---|---|---|---|
| Median Price | $555,000 | $405,000 | $285,000 | $290,500 | $269,950 | $317,000 | $285,500 | $317,000 |
| Price YOY | 14.4% | 11.6% | 15.4% | 3.8% | 5.9% | 13.6% | 5.7% | 7.1% |
| Active Listings | 3,554 | 1,680 | 2,655 | 912 | 1,095 | 527 | 522 | 863 |
| Listings YOY | 0.1% | -21.6% | -14.2% | -9.3% | -5.1% | -13.3% | -17.8% | -21.7% |
| Closed Sales | 2,803 | 1,278 | 1,400 | 417 | 503 | 180 | 204 | 299 |
| Sales YOY | -3.3% | 10.6% | 0.6% | -6.7% | 14.6% | -4.8% | 6.8% | -5.4% |
| Months of Supply | 1.3 | 1.3 | 1.9 | 2.2 | 2.2 | 2.9 | 2.6 | 2.9 |
King and Pierce counties saw the biggest bump in prices compared to a year ago, King was the only county that isn’t still bleeding inventory, and a few other counties joined King in seeing sales slip.
Here’s the chart of median prices compared to a year ago. Every county was up, with King, Snohomish, Pierce, and Island all still seeing double-digit gains. The smallest gains were in Kitsap and Skagit counties.
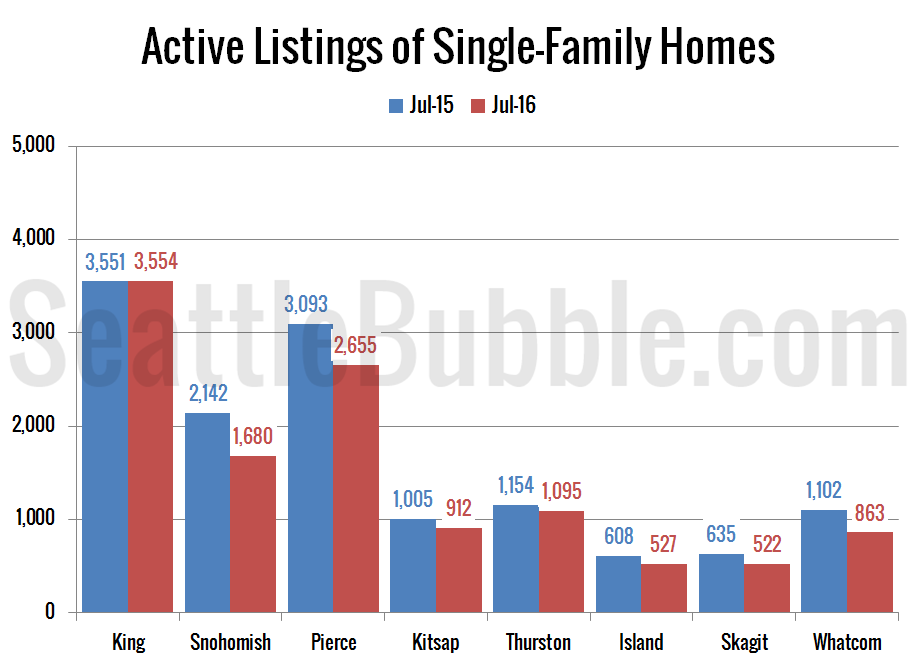
Listings were down significantly from a year earlier in most counties. King County was the exception to the trend, with listings basically flat from a year earlier. The biggest drop in listings was in Whatcom County, followed very closely by Snohomish County.
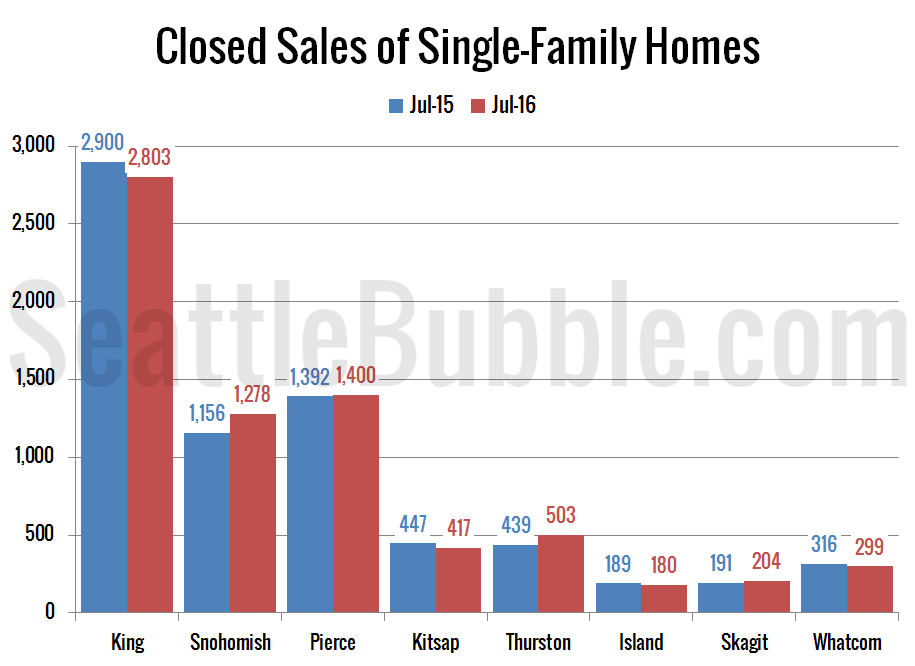
A few other counties joined King in the sales decline in July. King, Kitsap, Island, and Whatcom counties all saw fewer sales in July than a year earlier. Pierce was basically flat.
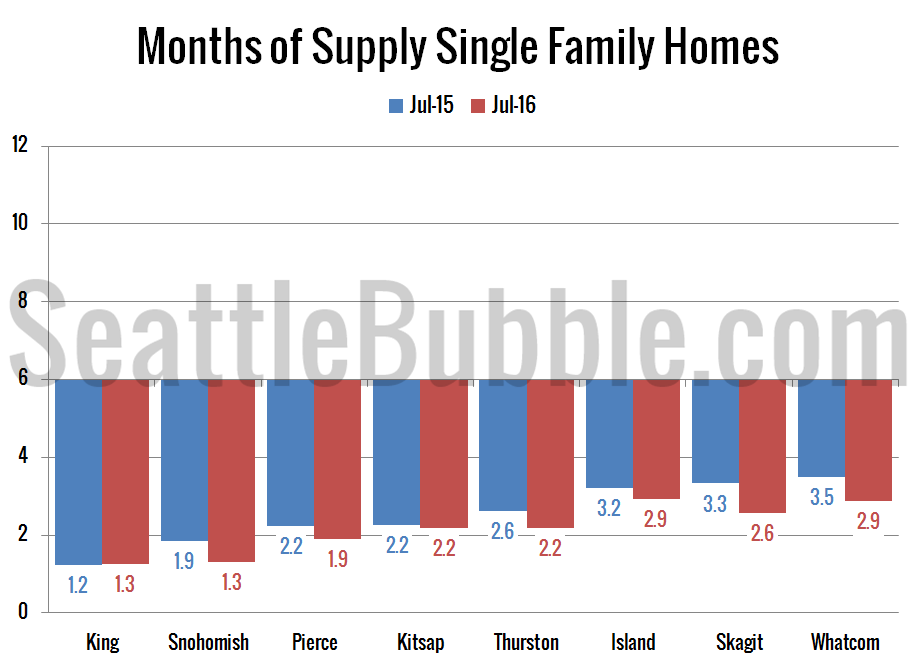
Months of supply is still terrible for buyers across the board. We’ll need quite a few more months of increasing inventory and decreasing sales before we start to see anything even remotely resembling a trend toward a buyer’s market for months of supply.
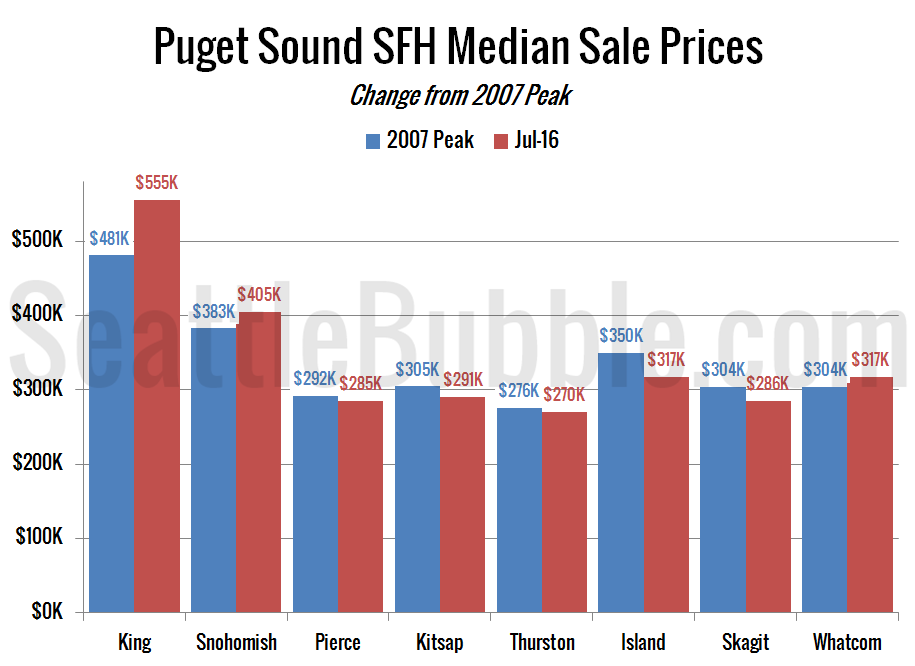
Finally, here’s a chart comparing the median price in July to the 2007 peak price in each county. King, Snohomish, and Whatcom counties are still the only counties to have prices above the 2007 peak.
In summary: It’s still a strong seller’s market, and will most likely continue to be at least through the end of this year. We’re seeing a few signs of moderation, but they are fairly weak, and not enough to flip the market very quickly.
If there is certain data you would like to see or ways you would like to see the data presented differently, drop a comment below and let me know.


