You can get access to the spreadsheets used to make the charts in this and other posts by becoming a member of Seattle Bubble.
With all of the first quarter behind us, and the question of whether or not we’re in another real estate bubble here in Seattle on everyone’s minds, let’s take an updated look at our affordability index charts for the counties around Puget Sound.
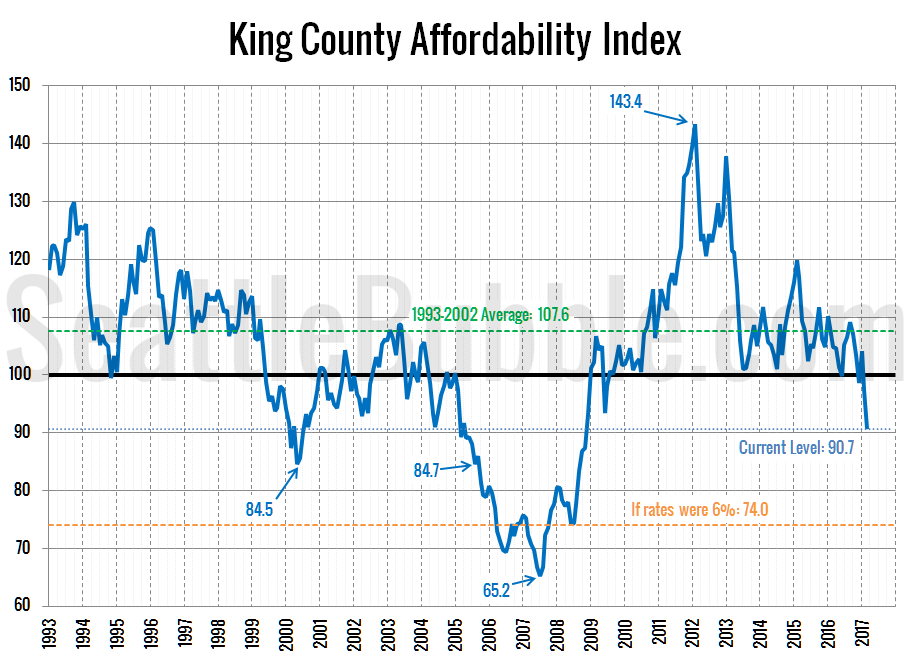
As of March, affordability has now fallen to its lowest level since November 2008, and as has been the case for quite a while, it would be considerably worse if not for the current absurdly low interest rates.
Median home prices have already begun their annual spring bump, while interest rates have ticked up slightly. The affordability index for King County currently sits at 90.7. An index level above 100 indicates that the monthly payment on a median-priced home costs less than 30% of the median household income.
I’ve marked where affordability would be if interest rates were at a slightly more sane level of 6 percent—74.0, which is worse than any point outside of early 2006 through late 2007.
If rates went up to a more historically “normal” level of 8 percent (the average rate through the ’90s), the affordability index would be at 60.4—five points lower than the record low level in July 2007.
What if rates were at 6.7 percent, the same level they were at in July 2007 when the affordability index bottomed out at 65.2? At that rate with today’s home prices and incomes, the affordability index would currently be 68.7.
In other words, ridiculously low interest rates are still the only thing propping up affordability in the Seattle area.
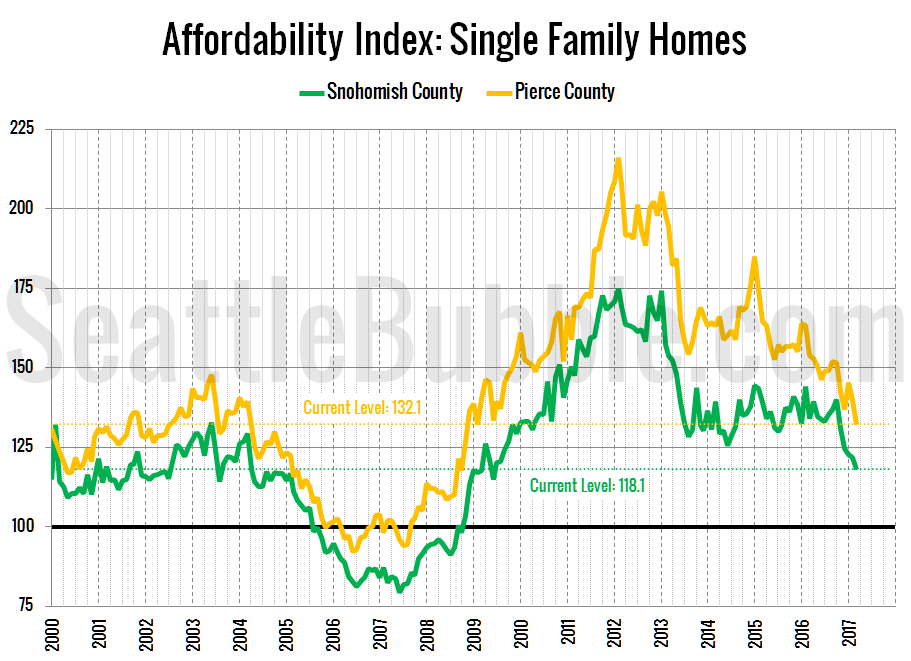
Here’s a look at the index for Snohomish County and Pierce County since 2000:
The affordability index in Snohomish currently sits at 118.1, while Pierce County is at 132.1. Both down considerably over the last few years.
In other affordability-related news, Zillow subsidiary Trulia recently released their own version of an affordability calculator. It is broken and gives terrible advice. Do not use it. If you adjust the interest rate, the calculator breaks. If you adjust the property tax rate, the calculator ignores the new value. They also claim that spending up to 36 percent of your income is “affordable,” despite years of precedent that “affordability” means not spending more than 30 percent of your income. I’m shocked that such a broken and misleading tool was published.
My own simple affordability calculator doesn’t have a lot of fancy features or the prettiest interface, but at least it works.
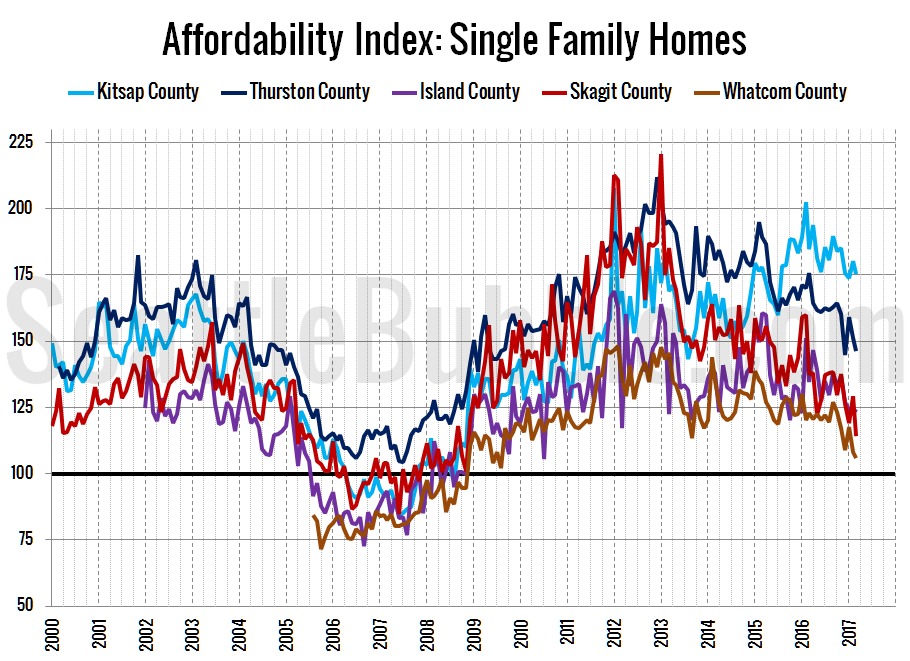
Tomorrow I will post updated versions of my charts of the “affordable” home price and income required to afford the median-priced home. Hit the jump for the affordability index methodology, as well as a bonus chart of the affordability index in the outlying Puget Sound counties.
As a reminder, the affordability index is based on three factors: median single-family home price as reported by the NWMLS, 30-year monthly mortgage rates as reported by the Federal Reserve, and estimated median household income as reported by the Washington State Office of Financial Management.
The historic standard for “affordable” housing is that monthly costs do not exceed 30% of one’s income. Therefore, the formula for the affordability index is as follows:
For a more detailed examination of what the affordability index is and what it isn’t, I invite you to read this 2009 post. Or, to calculate your the affordability of your own specific income and home price scenario, check out my Affordability Calculator.


