Skip to content

Seattle Bubble

local real estate news, statistics, and commentary without the sales spin.

Menu
  • Home
  • About
  • Contact
  • Reference
  • Speaking
Menu

Author: The Tim

Tim Ellis is the founder of Seattle Bubble. His background in engineering and computer / internet technology, a fondness of data-based analysis of problems, and an addiction to spreadsheets all influence his perspective on the Seattle-area real estate market. Tim also hosts the weekly improv comedy sci-fi podcast Dispatches from the Multiverse.

Consumer Confidence Keeps Climbing

Posted on March 31, 2014March 28, 2014 by The Tim

Let’s check in on how Consumer Confidence and mortgage interest rates fared during January. First up, here’s the Consumer Confidence data as of March: At 81.0, the Present Situation Index increased 0.7% between February and March, and is up 34% from a year earlier. The Present Situation Index is currently up 301% from its December…

Share:

  • Twitter
  • LinkedIn
  • Facebook
  • Reddit
  • Pinterest
  • Email

Weekly Open Thread (2014-03-31)

Posted on March 31, 2014March 31, 2014 by The Tim

NOTE: If you are subscribed to Seattle Bubble’s RSS feed and are seeing these open threads in the feed, please switch to our official feed at http://feeds.feedburner.com/SeattleBubble  Thanks! Here is your open thread for the week of March 31st, 2014. You may post random links and off-topic discussions here. Also, if you have an idea…

Share:

  • Twitter
  • LinkedIn
  • Facebook
  • Reddit
  • Pinterest
  • Email

Poll: Do you consider natural disasters when buying a home?

Posted on March 30, 2014April 13, 2014 by The Tim

This poll was active 03.30.2014 through 04.05.2014

Share:

  • Twitter
  • LinkedIn
  • Facebook
  • Reddit
  • Pinterest
  • Email

Case-Shiller Second Derivative Suggests Softer Prices

Posted on March 28, 2014March 28, 2014 by The Tim

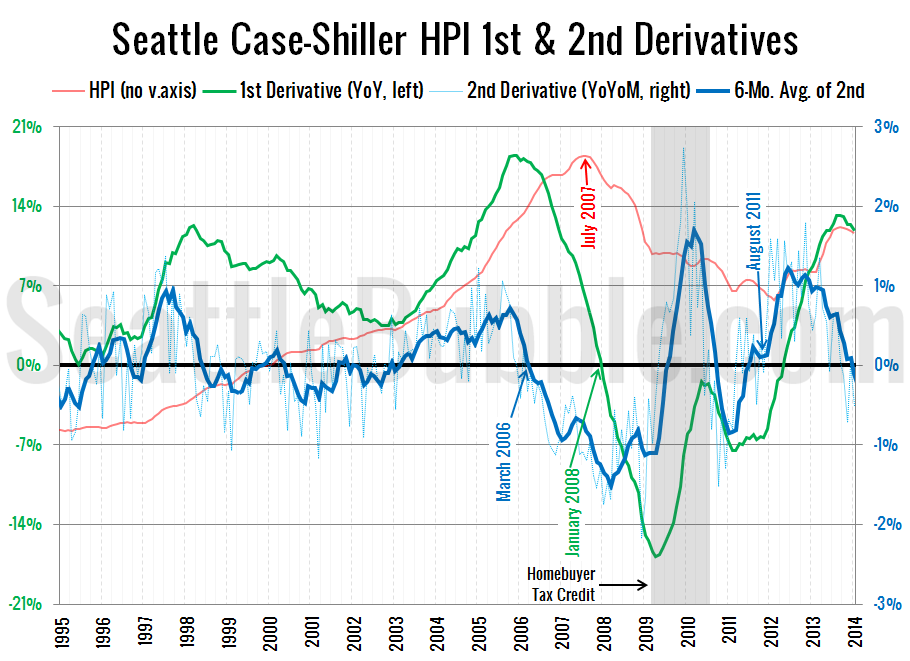
A reader requested an update to the second derivative chart of Seattle home prices, so here we go. This is a chart of the rate of change in the year-over-year change—the second derivative. For a more detailed explanation and some highlights of past inflection points, check out the original 2012 introduction of this chart. Here’s…

Share:

  • Twitter
  • LinkedIn
  • Facebook
  • Reddit
  • Pinterest
  • Email

Case-Shiller: Home Prices Weakest Since Early 2012

Posted on March 27, 2014March 27, 2014 by The Tim

Before we put away the January Case-Shiller data, let’s have a look at my favorite alternative Case-Shiller charts. First up, let’s take a look at the twenty-city month-over-month scorecard. Here’s the original post introducing this chart if you’d like more details. Click the image below for a super-wide version with the data back through 2000….

Share:

  • Twitter
  • LinkedIn
  • Facebook
  • Reddit
  • Pinterest
  • Email

Posts navigation

  • Previous
  • 1
  • …
  • 111
  • 112
  • 113
  • 114
  • 115
  • 116
  • 117
  • …
  • 878
  • Next

Tim’s Other Projects

Dispatches from the Multiverse

Tip Jar

Like what we're doing?

Drop us a tip!

Accounts

  • Log in
  • Entries feed
  • Comments feed
  • WordPress.org
©2024 Seattle Bubble | Built using WordPress and Responsive Blogily theme by Superb
Menu
  • Home
  • About
  • Contact
  • Reference
  • Speaking