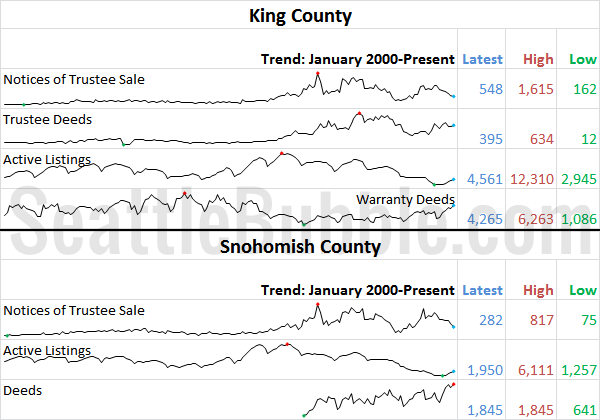
Now that the month of July is behind us, let’s have a look at our stats preview. Most of the charts below are based on broad county-wide data that is available through a simple search of King County and Snohomish County public records. If you have additional stats you’d like to see in the preview,…
Author: The Tim
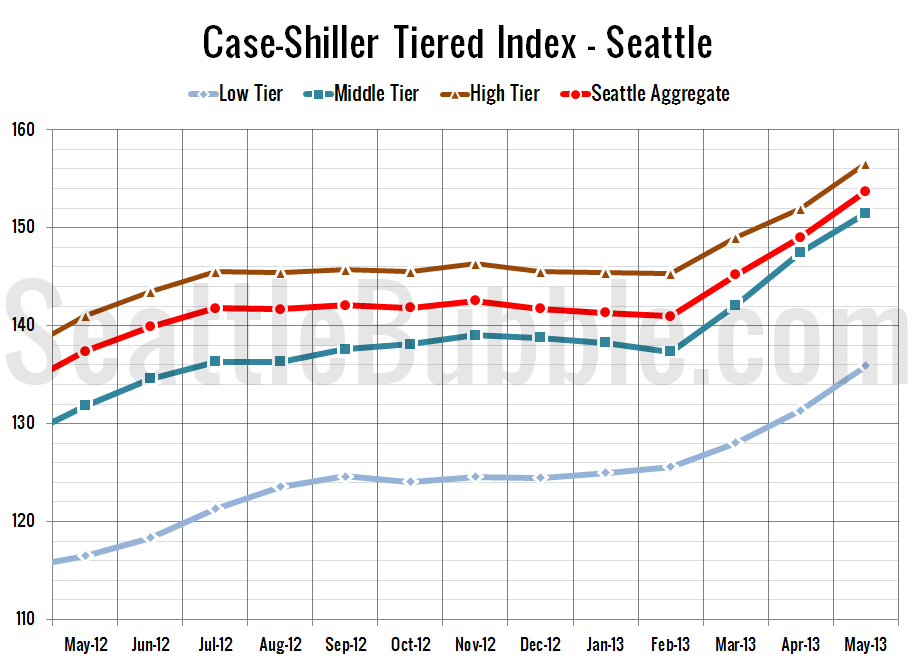
Case-Shiller Tiers: Low Tier Surged Most in May
Let’s check out the three price tiers for the Seattle area, as measured by Case-Shiller. Remember, Case-Shiller’s “Seattle” data is based on single-family home repeat sales in King, Pierce, and Snohomish counties. Note that the tiers are determined by sale volume. In other words, 1/3 of all sales fall into each tier. For more details…
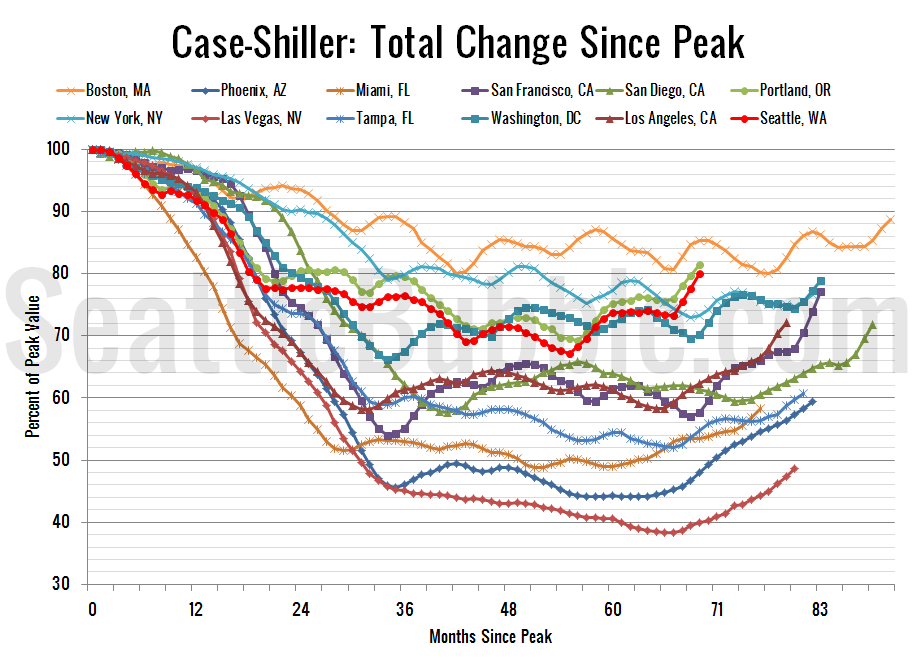
Case-Shiller: Seattle’s Spring Surge Continues
Let’s have a look at the latest data from the Case-Shiller Home Price Index. According to May data, Seattle-area home prices were: Up 3.1% April to May Up 11.9% YOY. Down 20.1% from the July 2007 peak Last year prices rose 2.6% from April to May and year-over-year prices were up 0.6%. Still no surprises,…
Real Actual Listing Photos: “Special Details” Edition
It’s time for another installment of Real Actual Listing Photos. Once a month (or so) I round up some of the most bizarre listing photos from around the Seattle area and post them here, with brief excerpts from the real actual listing description, and probably a bit of snarky commentary. Wow, it’s been over two…
Weekly Open Thread (2013-07-29)
NOTE: If you are subscribed to Seattle Bubble’s RSS feed and are seeing these open threads in the feed, please switch to our official feed at http://feeds.feedburner.com/SeattleBubble Thanks! Here is your open thread for the week of July 29th, 2013. You may post random links and off-topic discussions here. Also, if you have an idea…