NOTE: If you are subscribed to Seattle Bubble’s RSS feed and are seeing these open threads in the feed, please switch to our official feed at http://feeds.feedburner.com/SeattleBubble Thanks! Here is your open thread for the weekend beginning Friday February 22nd, 2013. You may post random links and off-topic discussions here. Also, if you have an…
Author: The Tim
Tim Ellis is the founder of Seattle Bubble. His background in engineering and computer / internet technology, a fondness of data-based analysis of problems, and an addiction to spreadsheets all influence his perspective on the Seattle-area real estate market. Tim also hosts the weekly improv comedy sci-fi podcast Dispatches from the Multiverse.
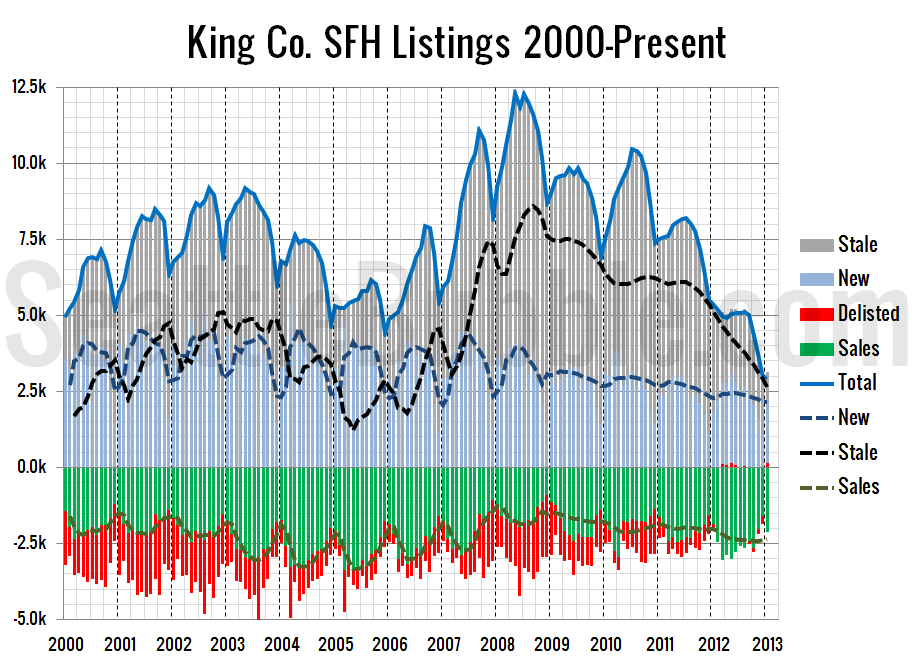
Listings Keep Shrinking; Very Few Homes Delisted in 2012
Here’s a view on listings that we haven’t visited in a while. In this chart I use the NWMLS-published data on new listings, pending sales, and total inventory to visualize the inflow and outflow of single-family listings in King County. First up is a chart that goes back as far as NWMLS data is available:…
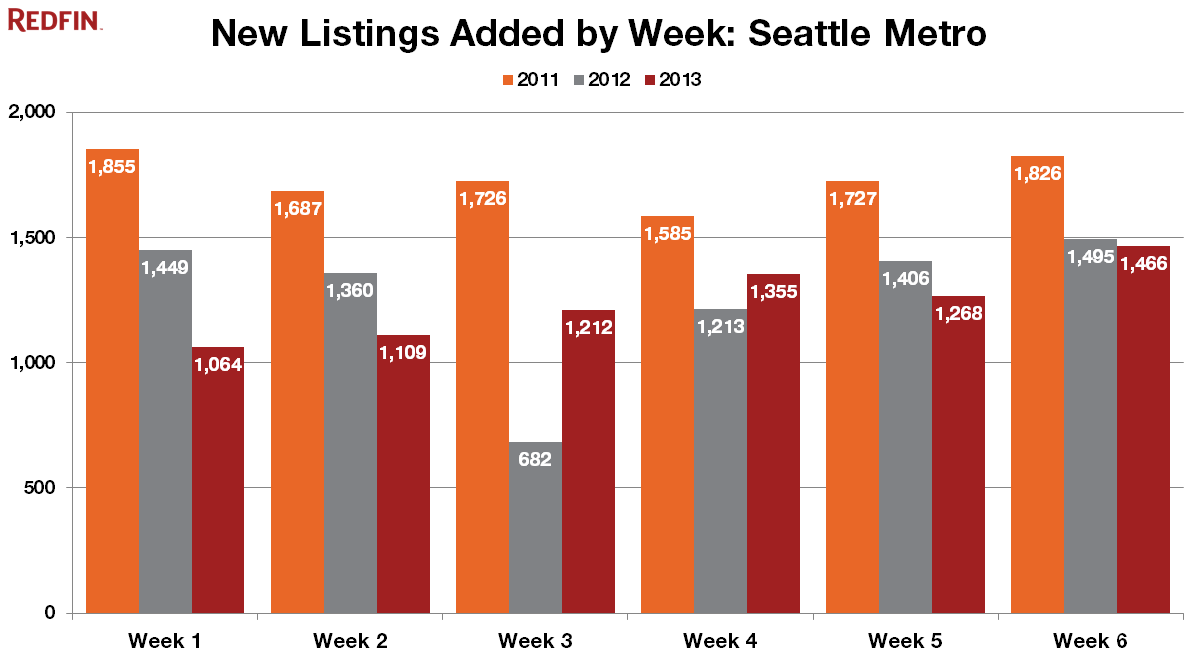
Distressed Inventory Shortage to Blame for Listings Drought
Full disclosure: The Tim is employed by Redfin. Let’s take a brief follow-up look at new listings. When we checked in two weeks into the new year, new listings in the Seattle area were down 25% from 2012. The data from this post is largely pulled out of a larger-scale analysis I did at work…
Mid-Week Open Thread (2013-02-20)
NOTE: If you are subscribed to Seattle Bubble’s RSS feed and are seeing these open threads in the feed, please switch to our official feed at http://feeds.feedburner.com/SeattleBubble Thanks! Here is your open thread for the mid-week on February 20th, 2013. You may post random links and off-topic discussions here. Also, if you have an idea…
Expensive Home Sales Dropped Off Dramatically in January
Let’s have another look at our monthly sales histogram. After flattening out somewhat between November and December the sales distribution curve became much steeper in January as sales above $300,000 fell off dramatically. In December the mode (i.e. the bucket with the most sales) for non-distressed sales was at $350,000 to $400,000, but in January…