Let’s check out the three price tiers for the Seattle area, as measured by Case-Shiller. Remember, Case-Shiller’s “Seattle” data is based on single-family home repeat sales in King, Pierce, and Snohomish counties. Note that the tiers are determined by sale volume. In other words, 1/3 of all sales fall into each tier. For more details…
Author: The Tim
Case-Shiller: Home Prices Slip Further Into Fall
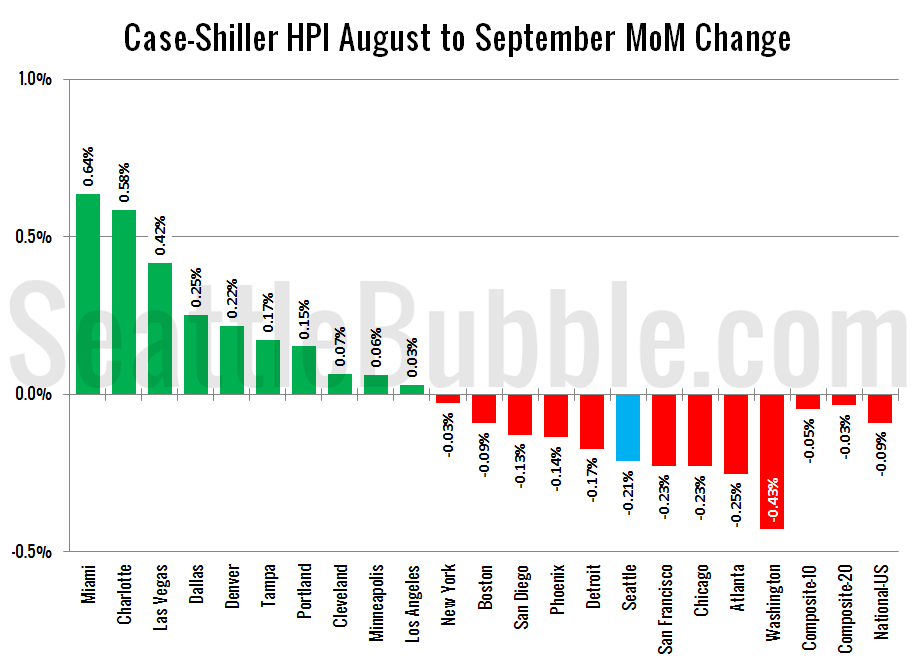
Let’s have a look at the latest data from the Case-Shiller Home Price Index. According to September data, Seattle-area home prices were: Down 0.2% August to September Up 6.0% YOY. Down 11.3% from the July 2007 peak Last year at this time prices were still rising. They increased 0.3% from August to September and year-over-year…
Weekly Open Thread (2014-11-24)
NOTE: If you are subscribed to Seattle Bubble’s RSS feed and are seeing these open threads in the feed, please switch to our official feed at http://feeds.feedburner.com/SeattleBubble Thanks! Here is your open thread for the week of November 24th, 2014. You may post random links and off-topic discussions here. Also, if you have an idea…
Poll: Does your house have a basement?
This poll was active 11.23.2014 through 11.29.2014
Affordable Home Price Climbs Above Median Price
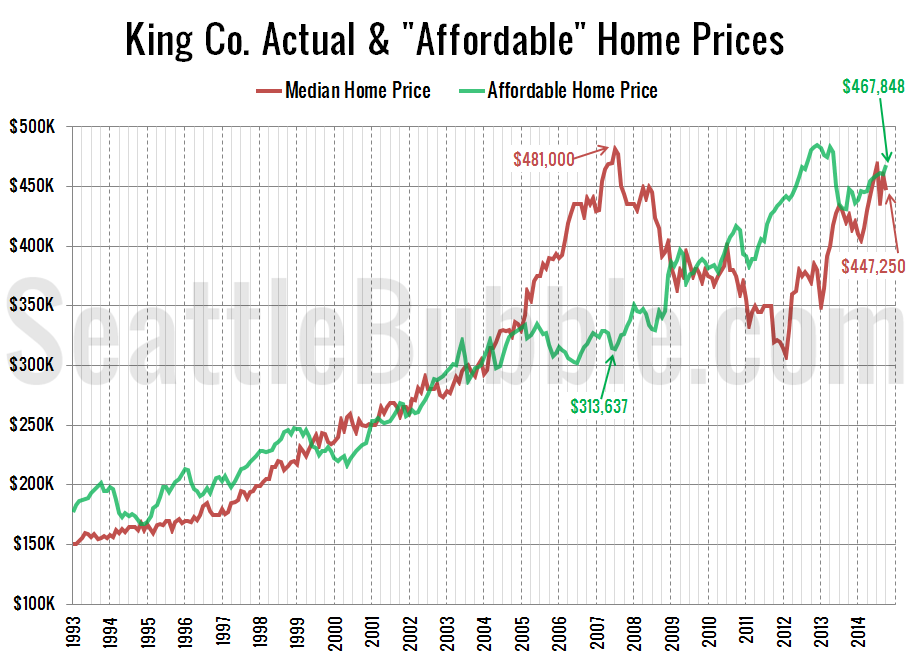
As promised in yesterday’s affordability post, here’s an updated look at the “affordable home” price chart. In this graph I flip the variables in the affordability index calculation around to other sides of the equation to calculate what price home the a family earning the median household income could afford to buy at today’s mortgage…