Let’s take a closer look at how listings fared in May of this year compared to years past. First up, here’s a look at how many new listings hit the market in May, comparing May 2014 to May in every year I’ve got data for. New listings hit a six-year high for the month of…
Category: Counties
County-wide statistics.
NWMLS: Sale Down, Listings Up, Price Gains Slowed in May
May market stats were published by the NWMLS this afternoon. Here’s a snippet from their press release: Housing Market Righting Itself as Buyers, Brokers Get Creative to Compete. Housing around Western Washington is on an upward trajectory, but inadequate inventory “in the right prices and locations” makes for a “very difficult market for purchasers and…
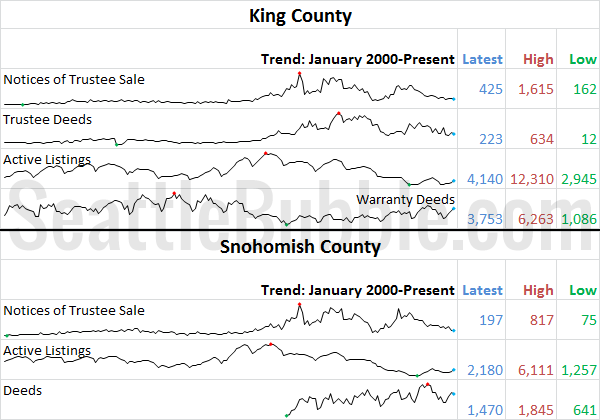
May Stats Preview: One Month Inventory Surge
Now that May is over, let’s have a look at our monthly stats preview. Most of the charts below are based on broad county-wide data that is available through a simple search of King County and Snohomish County public records. If you have additional stats you’d like to see in the preview, drop a line…
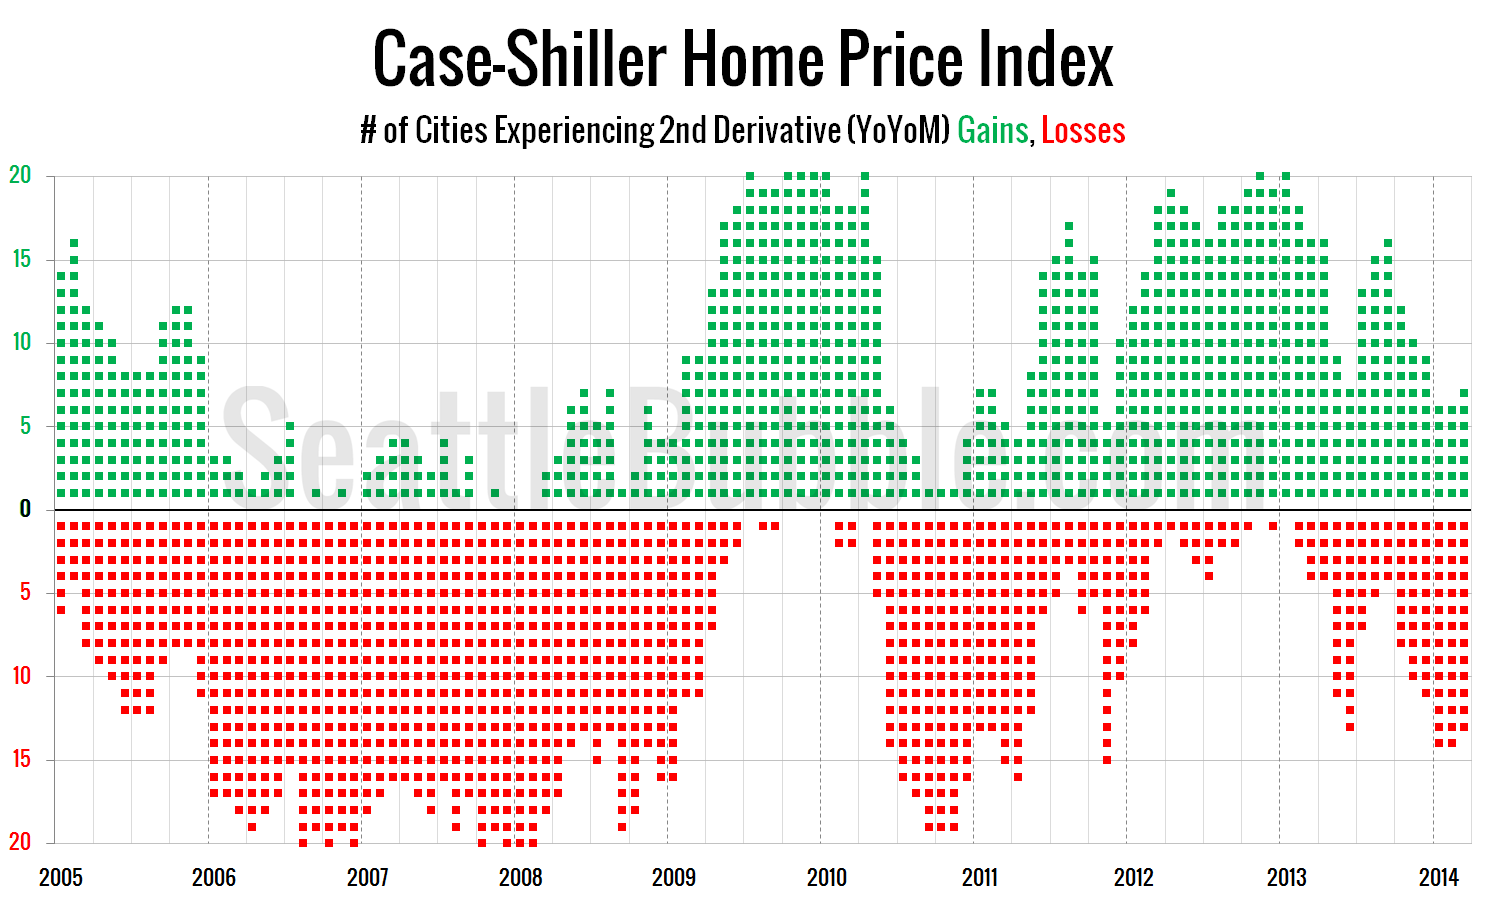
Case-Shiller Second Derivative Weakness Continues
Before we shelf the March Case-Shiller data, let’s have a look at my favorite alternative Case-Shiller charts. First up, let’s take a look at the twenty-city month-over-month scorecard. Here’s the original post introducing this chart if you’d like more details. Click the image below to enlarge, or click here for a super-wide version with the…
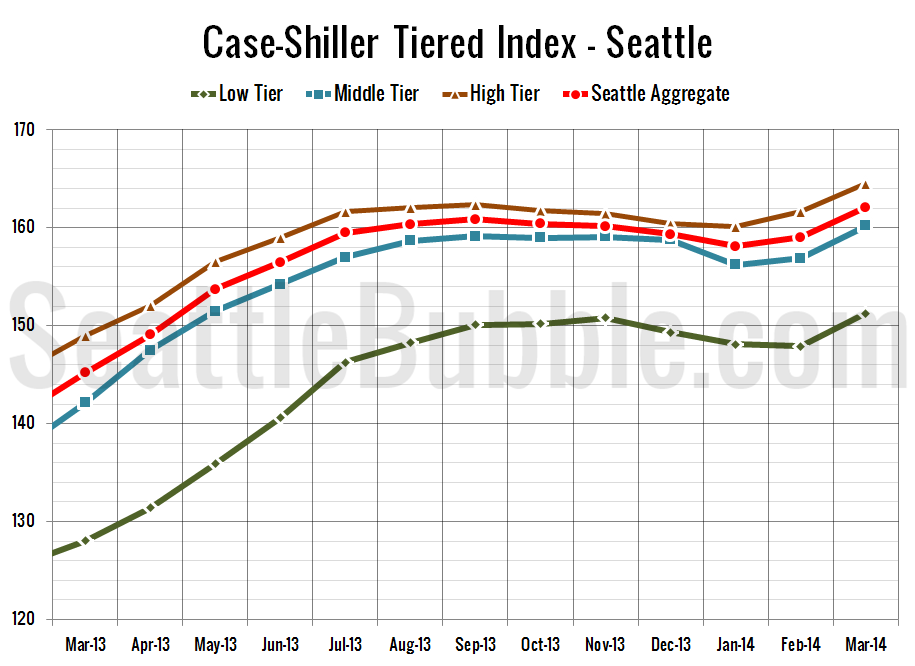
Case-Shiller Tiers: Low Tier Leads March Price Increases
Let’s check out the three price tiers for the Seattle area, as measured by Case-Shiller. Remember, Case-Shiller’s “Seattle” data is based on single-family home repeat sales in King, Pierce, and Snohomish counties. Note that the tiers are determined by sale volume. In other words, 1/3 of all sales fall into each tier. For more details…


