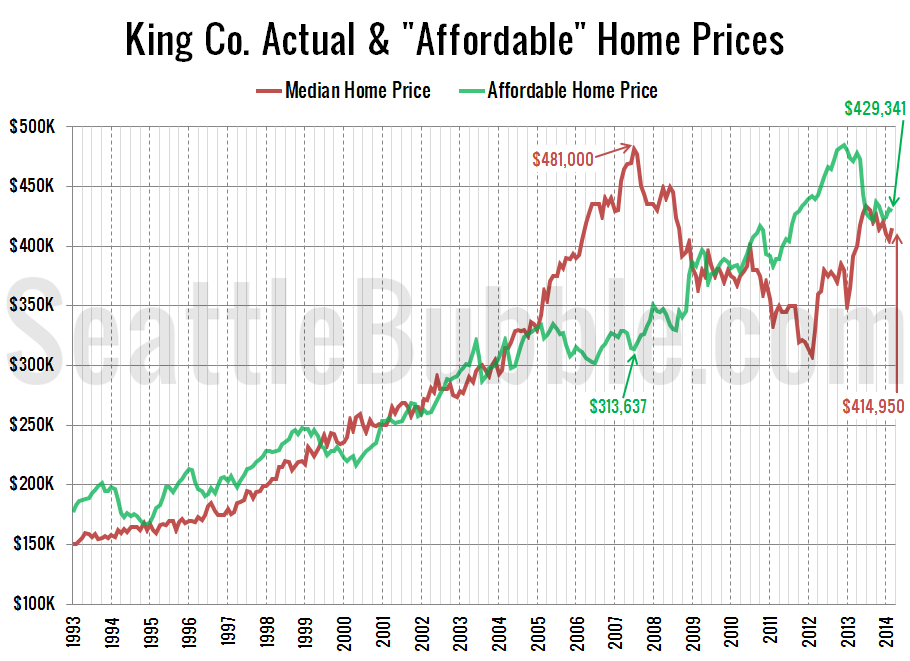
As promised in yesterday’s affordability post, here’s an updated look at the “affordable home” price chart. In this graph I flip the variables in the affordability index calculation around to other sides of the equation to calculate what price home the a family earning the median household income could afford to buy at today’s mortgage…
Category: Counties
County-wide statistics.
Affordability At Pre-Bubble Average Level
Let’s take a look at how affordability is doing in the Seattle area after the last couple months of changes in home prices and interest rates. So how does affordability look as of March? Basically on par with the long-term pre-bubble average. The index sits at 103.5, basically the same as January. An index level…
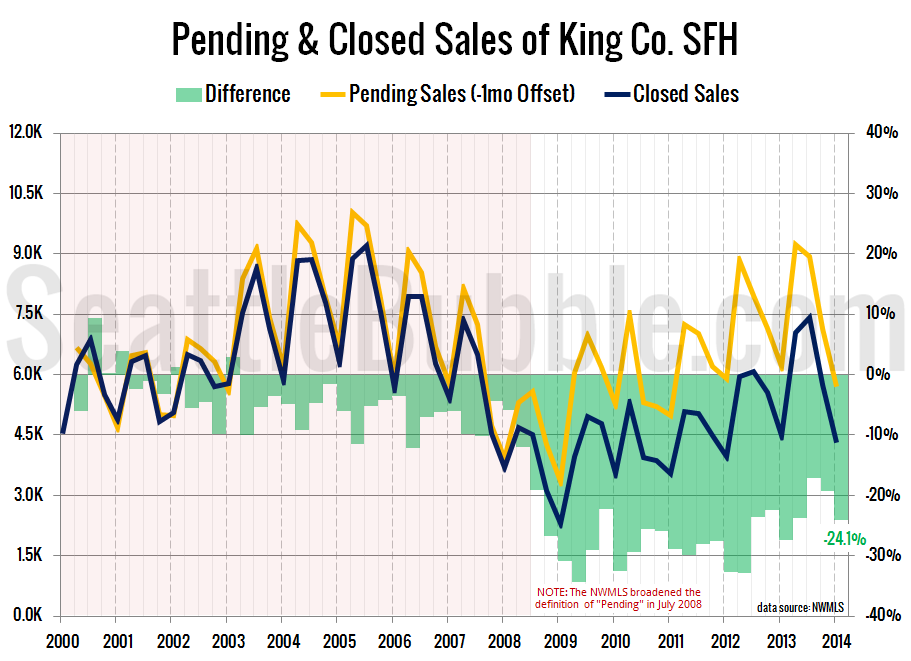
Nearly One in Four Pending Sales Did Not Close in Q1
Let’s take a look a the latest data on pending sales volume versus closed sales volume. For this series I roll the pending sales and closed sales data up by quarter, with pending sales offset by one month. In other words, the first quarter numbers below represent pending sales from December, January, and February and…
NWMLS: Housing Market Continued to Soften in March
March market stats were published by the NWMLS yesterday. Here’s a snippet from their press release: NWMLS brokers report mixed results for March, but suggest only lack of inventory is holding back sales. Northwest Multiple Listing Service brokers reported rising prices on fewer sales during March compared to a year ago, citing inventory shortages as…
Seattle-Area Unemployment at Late 2008 Levels
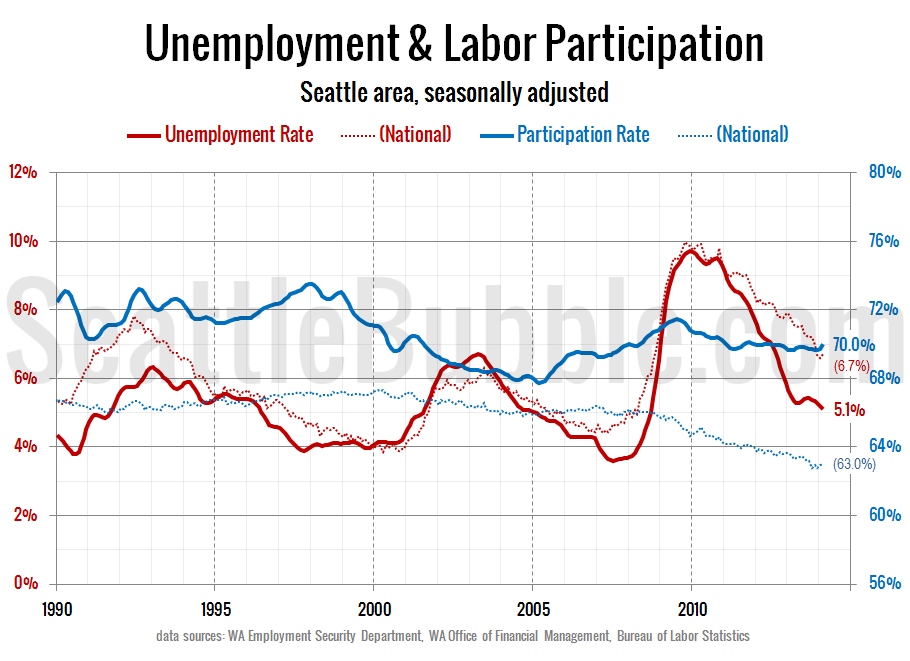
Let’s have a look at the jobs data for February and how the Seattle area’s unemployment rate and approximate labor participation rate alongside the national numbers. In February the Seattle area’s unemployment rate hit its lowest level since September 2008 at 5.1%. The national unemployment rate is still a bit higher at 6.7%, also roughly…


