Skip to content

Seattle Bubble

local real estate news, statistics, and commentary without the sales spin.

Menu
  • Home
  • About
  • Contact
  • Reference
  • Speaking
Menu

Category: Counties

County-wide statistics.

Undervalued to Overvalued in Less Than a Year

Posted on February 27, 2014February 27, 2014 by The Tim

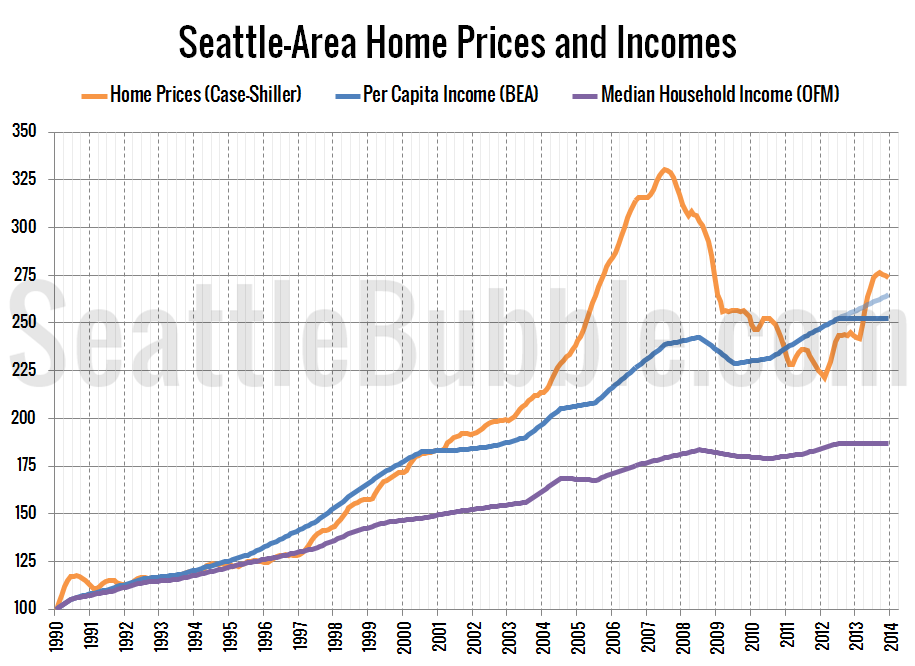
Local home prices gone from undervalued to overvalued in just a year. In January 2013, Seattle-area home prices as measured by the Case-Shiller Home Price Index were four or five percent below where local per capita incomes would suggest they should have been and one percent below where rents suggested. By December 2013, massive gains…

Share:

  • Twitter
  • LinkedIn
  • Facebook
  • Reddit
  • Pinterest
  • Email

Case-Shiller Tiers: Low Tier Dripped Most in December

Posted on February 26, 2014February 26, 2014 by The Tim

Let’s check out the three price tiers for the Seattle area, as measured by Case-Shiller. Remember, Case-Shiller’s “Seattle” data is based on single-family home repeat sales in King, Pierce, and Snohomish counties. Note that the tiers are determined by sale volume. In other words, 1/3 of all sales fall into each tier. For more details…

Share:

  • Twitter
  • LinkedIn
  • Facebook
  • Reddit
  • Pinterest
  • Email

Case-Shiller: Home Prices End 2013 On a Dip

Posted on February 25, 2014February 25, 2014 by The Tim

Let’s have a look at the latest data from the Case-Shiller Home Price Index. According to December data, Seattle-area home prices were: Down 0.5% November to December Up 12.4% YOY. Down 17.2% from the July 2007 peak Last year prices fell 0.5% from November to December and year-over-year prices were up 8.2%. Home prices in…

Share:

  • Twitter
  • LinkedIn
  • Facebook
  • Reddit
  • Pinterest
  • Email

Around the Sound: Prices Slip in Thurston & Kitsap

Posted on February 21, 2014February 21, 2014 by The Tim

It’s time for us to check up on stats outside of the King/Snohomish core with our “Around the Sound” statistics for Pierce, Kitsap, Thurston, Island, Skagit, and Whatcom counties. If there is certain data you would like to see or ways you would like to see the data presented differently, drop a comment below and…

Share:

  • Twitter
  • LinkedIn
  • Facebook
  • Reddit
  • Pinterest
  • Email

Affordable Home Price on Par with Median Price

Posted on February 18, 2014February 17, 2014 by The Tim

As promised in yesterday’s affordability post, here’s an updated look at the “affordable home” price chart. In this graph I flip the variables in the affordability index calculation around to other sides of the equation to calculate what price home the a family earning the median household income could afford to buy at today’s mortgage…

Share:

  • Twitter
  • LinkedIn
  • Facebook
  • Reddit
  • Pinterest
  • Email

Posts navigation

  • Previous
  • 1
  • …
  • 58
  • 59
  • 60
  • 61
  • 62
  • 63
  • 64
  • …
  • 145
  • Next

Tim’s Other Projects

Dispatches from the Multiverse

Tip Jar

Like what we're doing?

Drop us a tip!

Accounts

  • Log in
  • Entries feed
  • Comments feed
  • WordPress.org
©2024 Seattle Bubble | Built using WordPress and Responsive Blogily theme by Superb