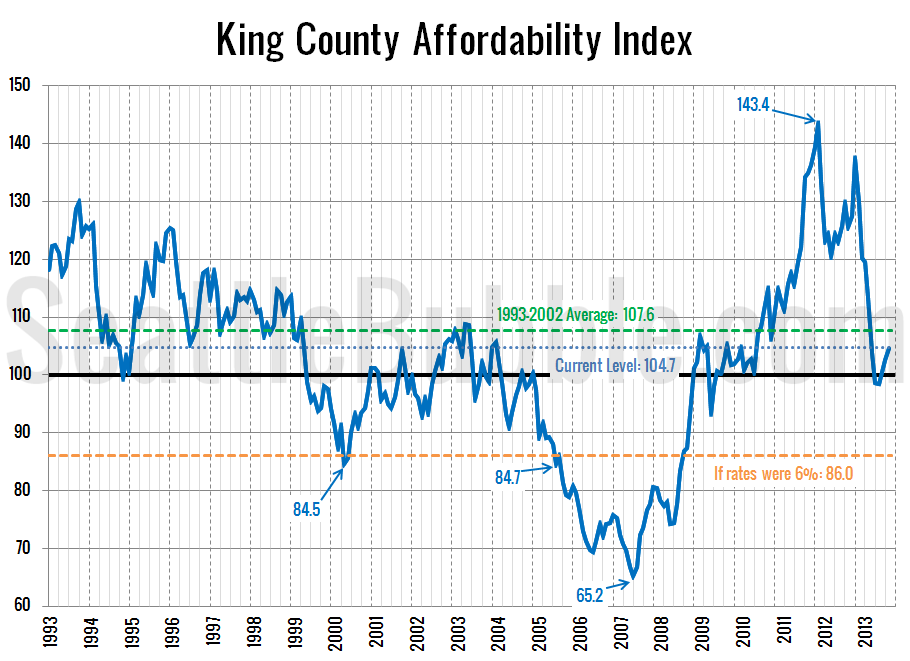
Let’s take a look at how affordability is doing in the Seattle area after the last couple months of changes in home prices and interest rates. So how does affordability look as of November? Slightly improved from July, August, and September. The index inched back up to 104.7 (i.e. the monthly payment on a median-priced…
Category: Counties
County-wide statistics.
Around the Sound: Balance Slowly Returning
It’s time for us to check up on stats outside of the King/Snohomish core with our “Around the Sound” statistics for Pierce, Kitsap, Thurston, Island, Skagit, and Whatcom counties. If there is certain data you would like to see or ways you would like to see the data presented differently, drop a comment below and…
Decline in Foreclosures Continued in November
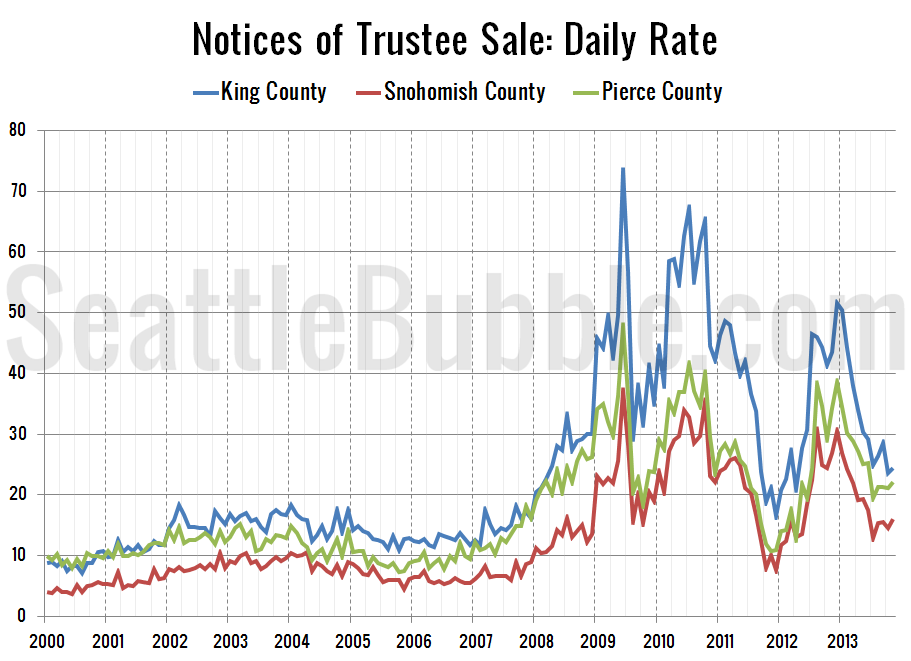
It’s time for our detailed look at November’s foreclosure stats in King, Snohomish, and Pierce counties. First up, the Notice of Trustee Sale summary: November 2013 King: 465 NTS, down 47% YOY Snohomish: 305 NTS, down 43% YOY Pierce: 421 NTS, down 39% YOY The number of trustee sale notices decreased month-over-month again in all…
NWMLS: Sales and Prices Slipped in November
November market stats were published by the NWMLS yesterday. Here’s a snippet from their press release: Home sales "chugging along," as recovery continues, but brokers expect prices, mortgage rates to rise in 2014. Improving inventory, stabilizing prices, fewer short sales, and a healthy local economy are credited with keeping the real estate market “chugging along…
November Stats Preview: Slumping Sales Edition
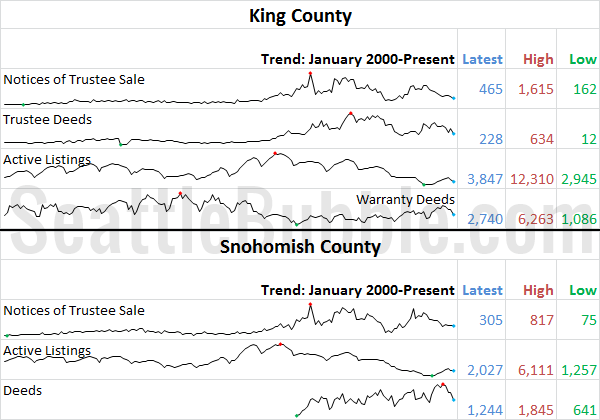
Now that November is behind us, let’s have a look at our stats preview. Most of the charts below are based on broad county-wide data that is available through a simple search of King County and Snohomish County public records. If you have additional stats you’d like to see in the preview, drop a line…


