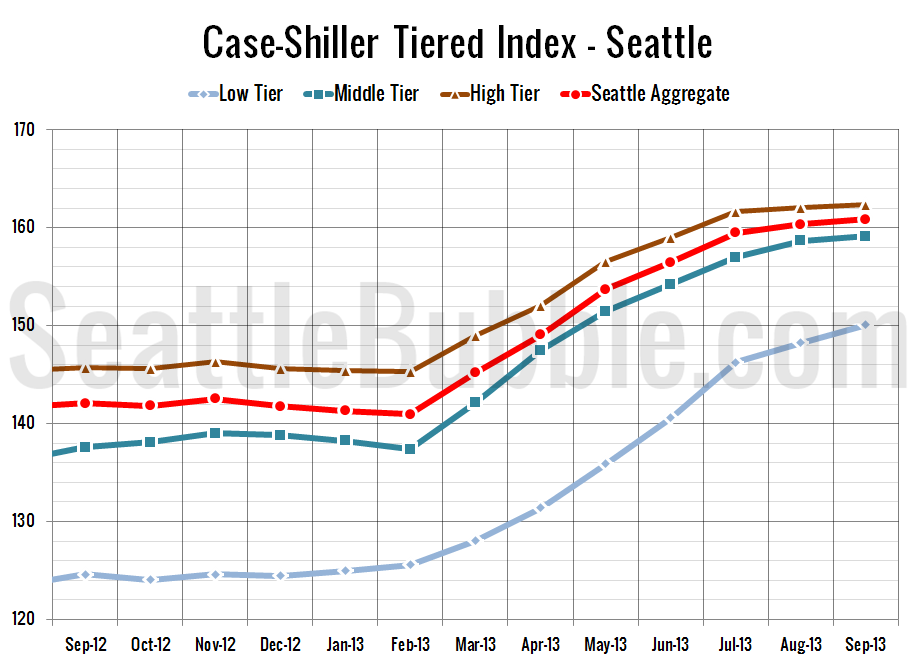
Let’s check out the three price tiers for the Seattle area, as measured by Case-Shiller. Remember, Case-Shiller’s “Seattle” data is based on single-family home repeat sales in King, Pierce, and Snohomish counties. Note that the tiers are determined by sale volume. In other words, 1/3 of all sales fall into each tier. For more details…
Category: Counties
County-wide statistics.
Case-Shiller: Home Price Gains Stall in September
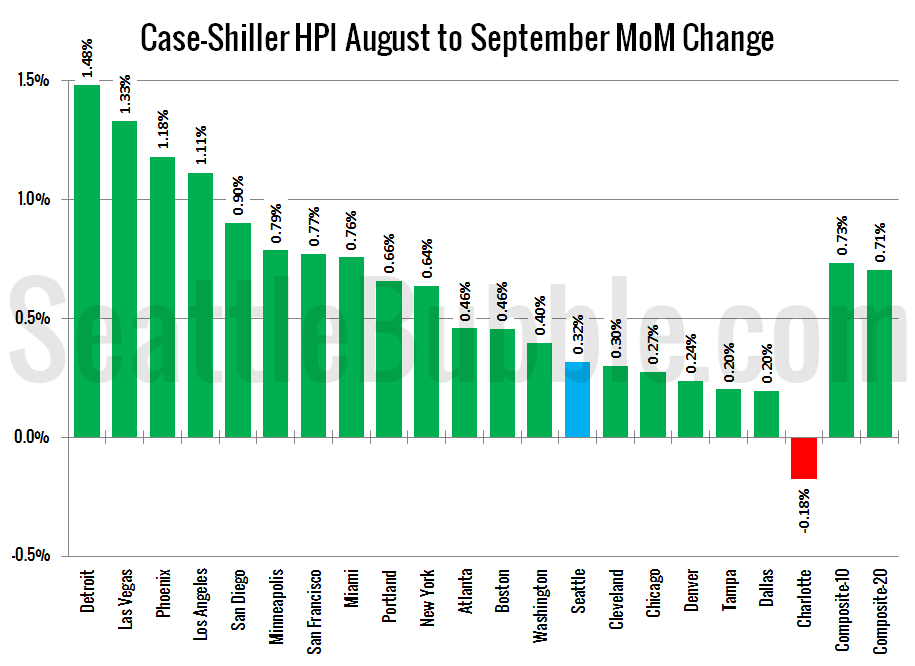
Let’s have a look at the latest data from the Case-Shiller Home Price Index. According to September data, Seattle-area home prices were: Up 0.3% August to September Up 13.2% YOY. Down 16.3% from the July 2007 peak Last year prices rose 0.3% from August to September and year-over-year prices were up 4.8%. Nothing really noteworthy…
Construction Job Growth Slows to a Crawl
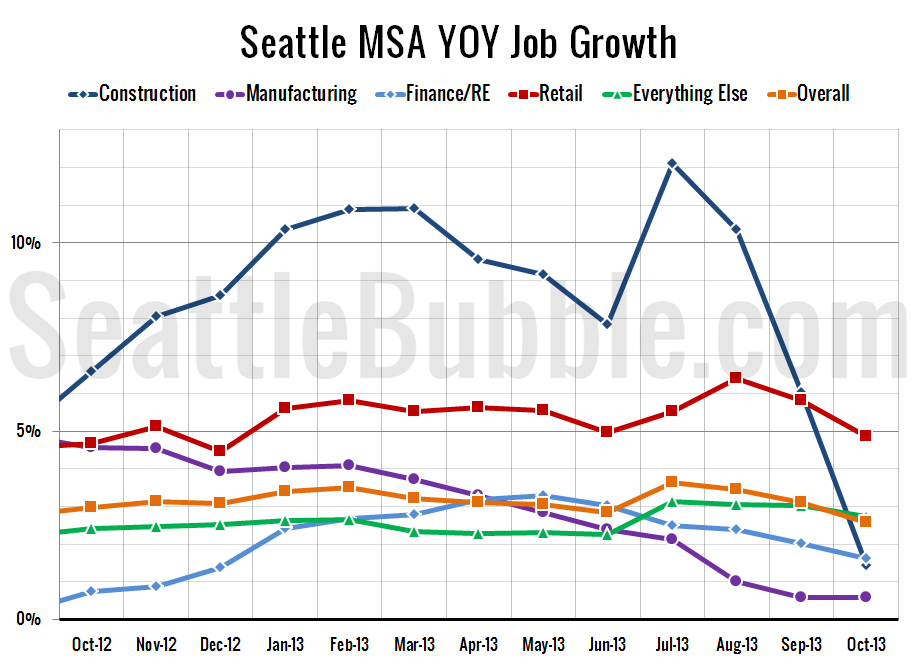
To follow up yesterday’s post on unemployment and labor force participation rate, here’s our breakdown of the job growth (or losses) in specific sectors for the Seattle area. First up, year-over-year job growth, broken down into a few relevant sectors: Here’s a look at just the last year zoomed in so you can see what’s…
Seattle Unemployment Increases Four Months in a Row
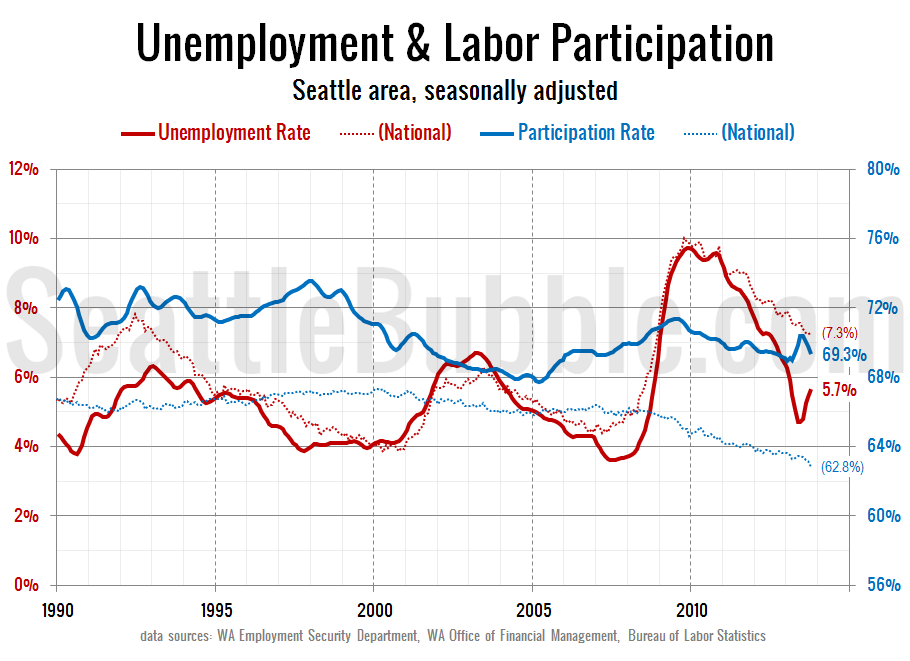
Jobs data for October was released yesterday, so I thought I’d post a chart I’ve been working on that shows the Seattle area’s unemployment rate and approximate labor participation rate alongside the national numbers. As of October, the Seattle area’s unemployment rate has been on a four-month uptick, increasing from 4.7% in May and June…
Fewer Pending Sales Failed to Close in Q3
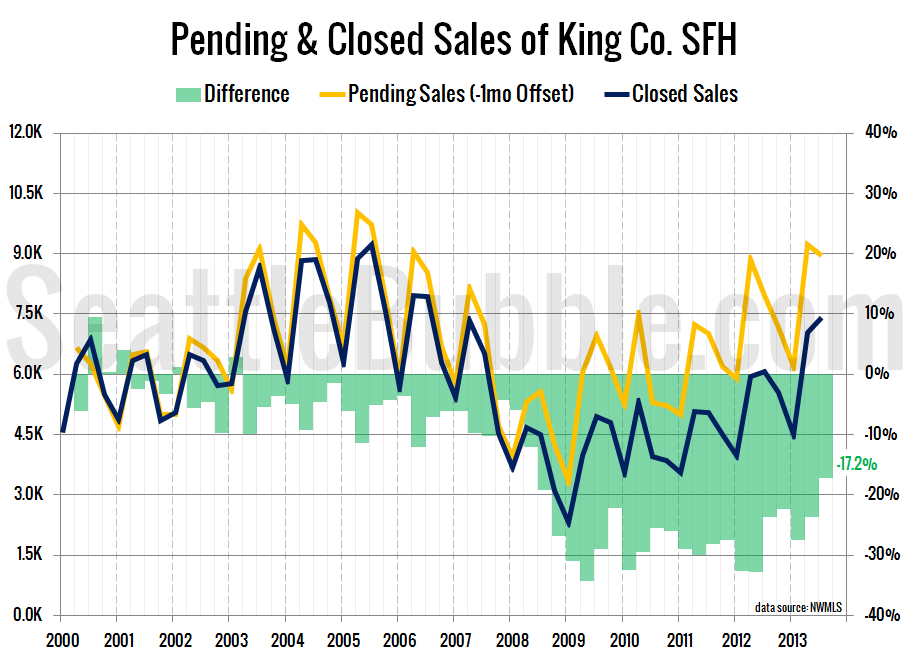
Let’s take a look a the latest data on pending sales volume versus closed sales volume. For this series I roll the pending sales and closed sales data up by quarter, with pending sales offset by one month. In other words, the third quarter numbers below represent pending sales from June, July, and August and…
