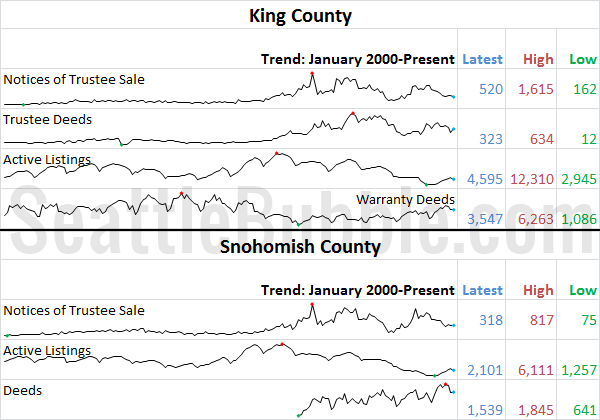
It’s time for our detailed look at October ‘s foreclosure stats in King, Snohomish, and Pierce counties. First up, the Notice of Trustee Sale summary: October 2013 King: 520 NTS, down 43% YOY Snohomish: 318 NTS, down 41% YOY Pierce: 464 NTS, down 28% YOY The number of trustee sale notices decreased month-over-month in King…
Category: Counties
County-wide statistics.

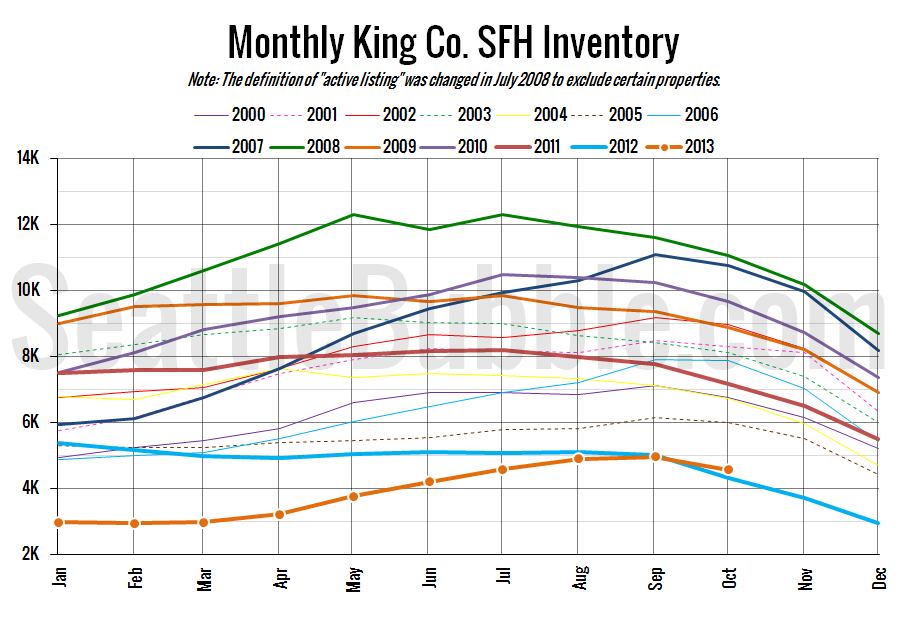
Listings Begin Typical Seasonal Decline in October
Let’s have a look at how listings are doing over the last few months. First up, here’s a view of how inventory has grown so far this year: 2013 is shaping up to have the fourth-largest one-year growth in inventory on record, behind 2007, 2006, and 2001. Next, the last three months’ worth of new…
NWMLS: Listings Up From 2012, Pending Sales Down
October market stats are now available from the NWMLS. Here’s a snippet from their press release: Home sales "pause" with government shutdown, but brokers mostly bullish on market recovery. Home sales “paused” during October but prices continued to rise, according to the latest statistics from Northwest Multiple Listing Service. Commenting on year-to-date totals for 2013…
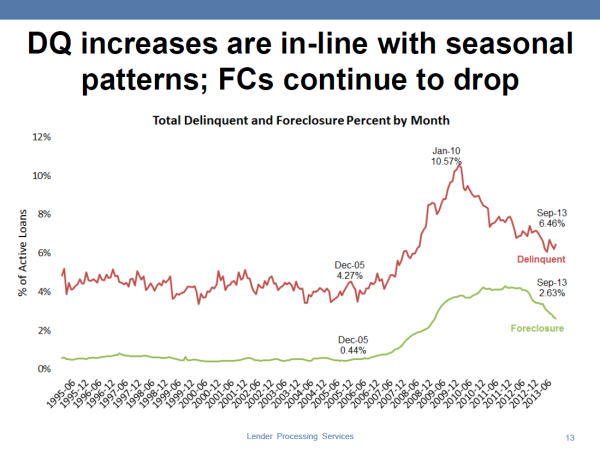
Undocumented Shadow Inventory Scarce in King County
Don’t worry: This will be my last post about the shadow inventory issue for quite some time. In last Friday’s post about shadow inventory, “Haybaler” shared a great link in which Calculated Risk reported LPS delinquency data for September. This data addresses the main complaint some of you have raised about my previous analysis of…
October Stats Preview: Inventory Up Year-Over-Year Edition
With the month of September now in the history books, let’s have a look at our stats preview. Most of the charts below are based on broad county-wide data that is available through a simple search of King County and Snohomish County public records. If you have additional stats you’d like to see in the…