Skip to content

Seattle Bubble

local real estate news, statistics, and commentary without the sales spin.

Menu
  • Home
  • About
  • Contact
  • Reference
  • Speaking
Menu

Category: Counties

County-wide statistics.

Case-Shiller: Second Derivative Gains Rapidly Evaporating

Posted on August 2, 2013September 4, 2013 by The Tim

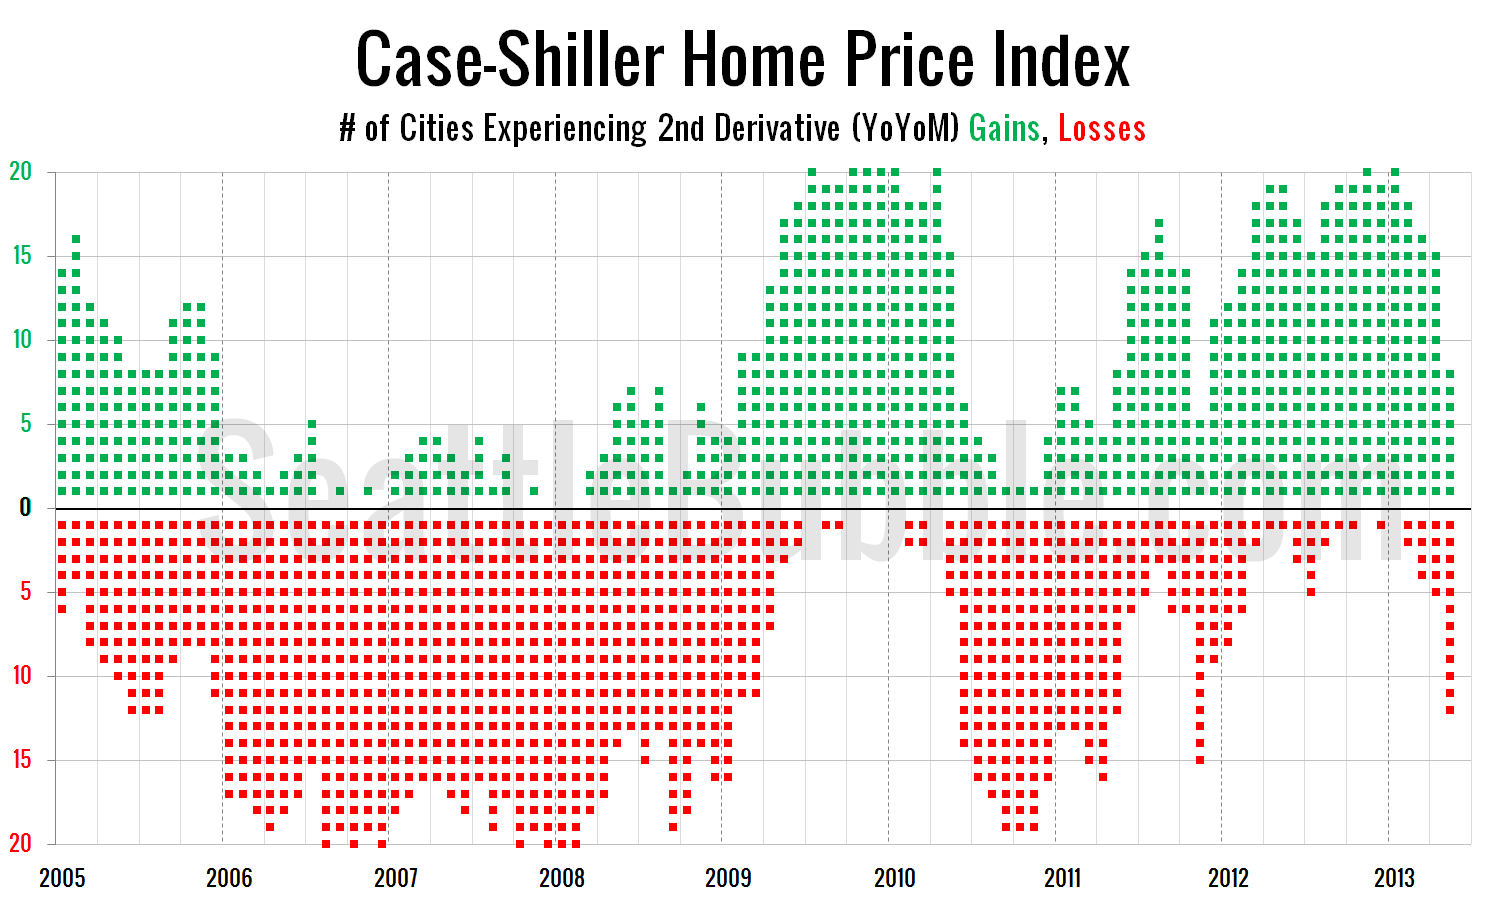
Before we put away the May Case-Shiller data, let’s have a look at my favorite alternative Case-Shiller charts. First up, let’s take a look at the twenty-city month-over-month scorecard. Here’s the original post introducing this chart if you’d like more details. Click the image below for a super-wide version with the data back through 2000….

Share:

  • Twitter
  • LinkedIn
  • Facebook
  • Reddit
  • Pinterest
  • Email

July Stats Preview: Ongoing Inventory Recovery Edition

Posted on August 1, 2013August 1, 2013 by The Tim

Now that the month of July is behind us, let’s have a look at our stats preview. Most of the charts below are based on broad county-wide data that is available through a simple search of King County and Snohomish County public records. If you have additional stats you’d like to see in the preview,…

Share:

  • Twitter
  • LinkedIn
  • Facebook
  • Reddit
  • Pinterest
  • Email

Case-Shiller Tiers: Low Tier Surged Most in May

Posted on July 31, 2013July 30, 2013 by The Tim

Let’s check out the three price tiers for the Seattle area, as measured by Case-Shiller. Remember, Case-Shiller’s “Seattle” data is based on single-family home repeat sales in King, Pierce, and Snohomish counties. Note that the tiers are determined by sale volume. In other words, 1/3 of all sales fall into each tier. For more details…

Share:

  • Twitter
  • LinkedIn
  • Facebook
  • Reddit
  • Pinterest
  • Email

Case-Shiller: Seattle’s Spring Surge Continues

Posted on July 30, 2013July 30, 2013 by The Tim

Let’s have a look at the latest data from the Case-Shiller Home Price Index. According to May data, Seattle-area home prices were: Up 3.1% April to May Up 11.9% YOY. Down 20.1% from the July 2007 peak Last year prices rose 2.6% from April to May and year-over-year prices were up 0.6%. Still no surprises,…

Share:

  • Twitter
  • LinkedIn
  • Facebook
  • Reddit
  • Pinterest
  • Email

New Listings Return to Levels that Outpace Pending Sales

Posted on July 25, 2013July 25, 2013 by The Tim

Let’s take one more look at how listings are recovering over the last few months. This first chart shows the difference between the number of new listings each month and the number of pending sales. Prior to late 2011 this number was almost always positive, except in December, when very few new listings hit the…

Share:

  • Twitter
  • LinkedIn
  • Facebook
  • Reddit
  • Pinterest
  • Email

Posts navigation

  • Previous
  • 1
  • …
  • 71
  • 72
  • 73
  • 74
  • 75
  • 76
  • 77
  • …
  • 145
  • Next

Tim’s Other Projects

Dispatches from the Multiverse

Tip Jar

Like what we're doing?

Drop us a tip!

Accounts

  • Log in
  • Entries feed
  • Comments feed
  • WordPress.org
©2024 Seattle Bubble | Built using WordPress and Responsive Blogily theme by Superb