Let’s have a look at the latest data from the Case-Shiller Home Price Index. According to February data, Seattle-area home prices were: Down 0.2% January to February Up 9.3% YOY. Down 26.7% from the July 2007 peak Last year prices fell 0.8% from January to February and year-over-year prices were down 2.9%. I was actually…
Category: Counties
County-wide statistics.
Seattle Unemployment Drops Again as Job Gains Continue
New local job stats came out this week, so let’s have a look at the Seattle area’s employment situation. First up, year-over-year job growth, broken down into a few relevant sectors: Construction growth dipped again, dropping from a 5.9% year-over-year gain in February to 5.2% in March. With 6.4% year-over-year growth, the retail sector was…
All Sale Price Tiers Bumped Up in March
Let’s have another look at our monthly sales histogram. Sales across all price tiers got a big boost in March, while the sales curve stayed basically the same shape as February. The mode (i.e. the bucket with the most sales) for non-distressed sales moved from the $400,000 to $450,000 bucket in February down to the…
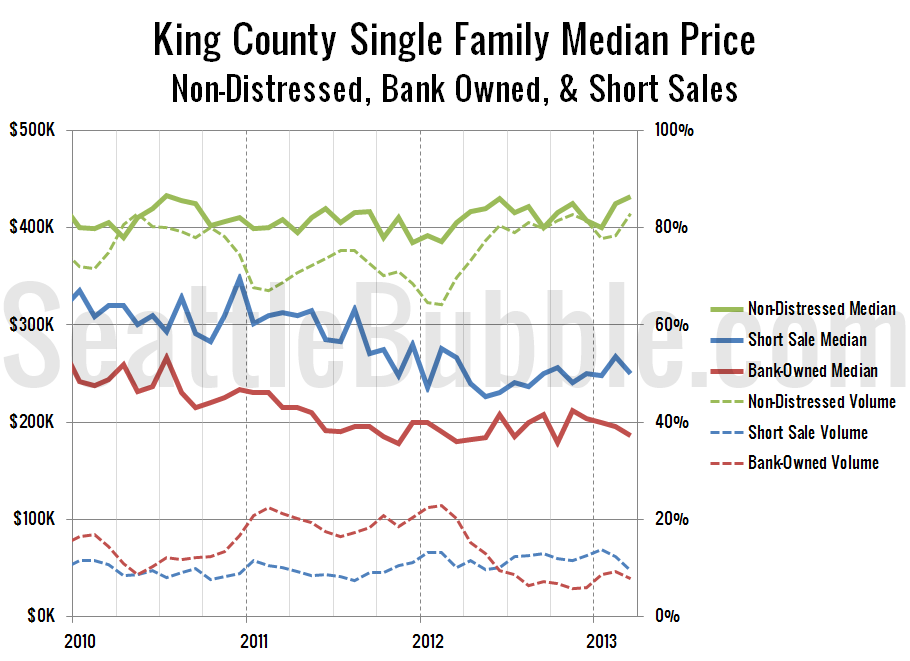
Non-Distressed Median Price Gains Slow
As promised last week, it’s time to check up on median home sale prices broken down by distress status: Non-distressed, bank-owned, and short sales. As of March, the non-distressed median price for King County single family home sales sits at $432,000, up 6.7% from a year earlier and up 1.6% from February. Not much of…
Foreclosure Notices Around Seattle Flat in March
It’s time for our detailed look at March’s foreclosure stats in King, Snohomish, and Pierce counties. First up, the Notice of Trustee Sale summary: March 2013 King: 795 NTS, up 33% YOY Snohomish: 462 NTS, up 32% YOY Pierce: 605 NTS, up 57% YOY All three counties still above their levels from a year ago,…


