December market stats were published by the NWMLS this morning. Here’s a snippet from their press release: Brokers report brisk sales, but rising frustration for home buyers. “I personally have never seen the ratio between active buyers and available inventory in Seattle’s close-in neighborhoods so out of balance,” remarked Mike Skahen, owner/designated broker at Lake…
Category: Counties
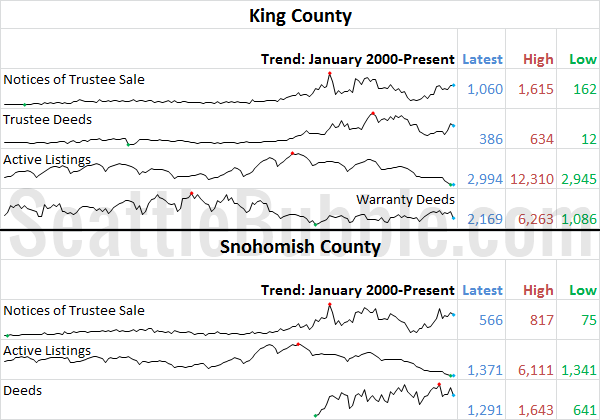
County-wide statistics.
January Stats Preview: Inventory Inching Up Edition
Now that we’ve got a full month of 2013 under our belt, let’s have a look at our stats preview. Most of the charts below are based on broad county-wide data that is available through a simple search of King County and Snohomish County public records. If you have additional stats you’d like to see…
Case-Shiller Tiers: All Three Tiers Defy Seasonality
Let’s check out the three price tiers for the Seattle area, as measured by Case-Shiller. Remember, Case-Shiller’s “Seattle” data is based on single-family home repeat sales in King, Pierce, and Snohomish counties. Note that the tiers are determined by sale volume. In other words, 1/3 of all sales fall into each tier. For more details…
Case-Shiller: Seattle Home Prices Up Again in November
Let’s have a look at the latest data from the Case-Shiller Home Price Index. According to November data, Seattle-area home prices were: Up 0.5% October to November. Up 7.4% YOY. Down 25.9% from the July 2007 peak Last year prices fell 1.2% from October to November and year-over-year prices were down 6.3%. It is a…
Seattle Area Keeps Adding Jobs, Washington Unemployment Falls Below National Rate
Let’s have a look at the Seattle area’s employment situation. First up, year-over-year job growth, broken down into a few relevant sectors: Construction is posting gangbuster gains—up 11.5% year-over-year—as homebuilders attempt to capitalize on the inventory crunch. Finance / Real Estate is posting the smallest gains at just 0.8% year-over-year growth. Here’s a look at…