Skip to content

Seattle Bubble

local real estate news, statistics, and commentary without the sales spin.

Menu
  • Home
  • About
  • Contact
  • Reference
  • Speaking
Menu

Category: Counties

County-wide statistics.

Low Rates Keep the “Affordable” Home Price Inflated

Posted on January 14, 2013January 14, 2013 by The Tim

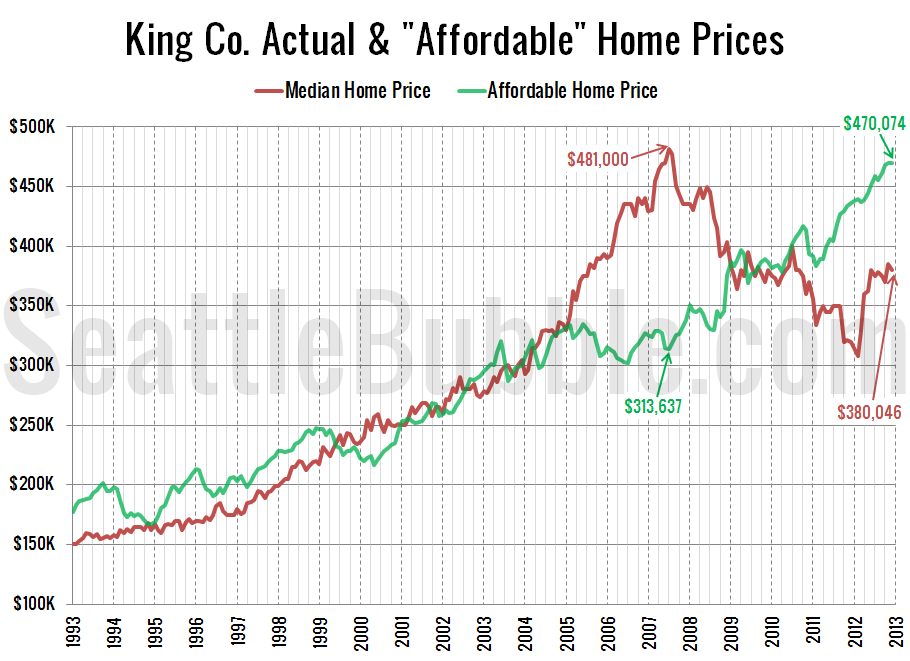
Since we looked at the affordability index last week, Let’s have an updated look at the “affordable home” price chart. In this graph I flip the variables in the affordability index calculation around to other sides of the equation to calculate what price home the median household income could afford to buy at today’s mortgage…

Share:

  • Twitter
  • LinkedIn
  • Facebook
  • Reddit
  • Pinterest
  • Email

Near-Record Affordability Still Driven by Low Rates

Posted on January 10, 2013January 10, 2013 by The Tim

It has been a while since we had a look at the local affordability index, and now that we’ve got all of the data for 2012, it seemed like a good time to take another look. As a reminder, the affordability index is based on three factors: median single-family home price as reported by the…

Share:

  • Twitter
  • LinkedIn
  • Facebook
  • Reddit
  • Pinterest
  • Email

NWMLS: 2012 Ends on a Sour Note for Buyers

Posted on January 7, 2013January 7, 2013 by The Tim

December market stats were published by the NWMLS this morning. Here’s a snippet from their press release: Northwest MLS Tallies Busy December as First-time Buyers, Investors Return. Brokers expect the housing market rebound to continue, while cautioning sellers to refrain from becoming too greedy and expressing hope for “controlled natural growth” to sustain the recovery….

Share:

  • Twitter
  • LinkedIn
  • Facebook
  • Reddit
  • Pinterest
  • Email

December Stats Preview: Foreclosure Surge Edition

Posted on January 3, 2013January 3, 2013 by The Tim

With the last month of 2012 now behind us, let’s have a look at our stats preview. Most of the charts below are based on broad county-wide data that is available through a simple search of King County and Snohomish County public records. If you have additional stats you’d like to see in the preview,…

Share:

  • Twitter
  • LinkedIn
  • Facebook
  • Reddit
  • Pinterest
  • Email

Case-Shiller Tiers: High & Low Tier Begin Seasonal Decline

Posted on December 27, 2012 by The Tim

Let’s check out the three price tiers for the Seattle area, as measured by Case-Shiller. Remember, Case-Shiller’s “Seattle” data is based on single-family home repeat sales in King, Pierce, and Snohomish counties. Note that the tiers are determined by sale volume. In other words, 1/3 of all sales fall into each tier. For more details…

Share:

  • Twitter
  • LinkedIn
  • Facebook
  • Reddit
  • Pinterest
  • Email

Posts navigation

  • Previous
  • 1
  • …
  • 85
  • 86
  • 87
  • 88
  • 89
  • 90
  • 91
  • …
  • 145
  • Next

Tim’s Other Projects

Dispatches from the Multiverse

Tip Jar

Like what we're doing?

Drop us a tip!

Accounts

  • Log in
  • Entries feed
  • Comments feed
  • WordPress.org
©2024 Seattle Bubble | Built using WordPress and Responsive Blogily theme by Superb