Let’s check in on the sales histogram again. In exploring this data, the biggest thing that jumps out to me is how much non-distressed homes above the median price have surged in the last year. Last November there were 407 non-distressed single-family homes sales in King County under $350,000 and 621 for $350,000 and up….
Category: Statistics
Statistics, number-based analysis, etc.
Consumer Confidence Inching Back to Normal
It’s been a few months since we visited the subject of consumer confidence, so let’s update our interactive chart again. You can drag the time sliders below the chart to view data going all the way back to 1998. Powered by Tableau At 56.6, the Present Situation Index has gained 180% from its December 2009…
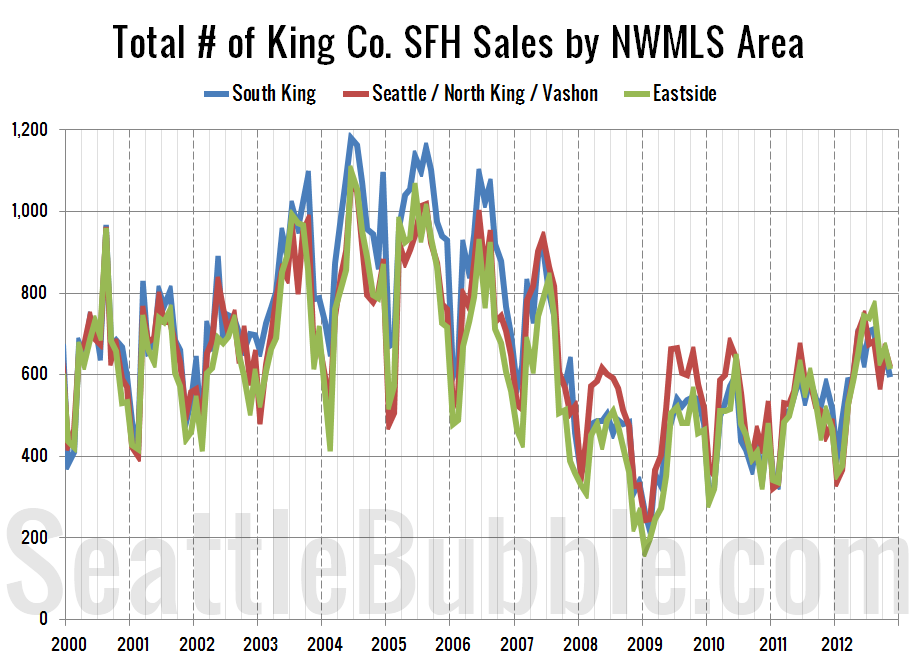
Eastside Prices Stall; Seattle & South King Gain Ground
Let’s take an updated look at how King County’s sales are shifting between the different regions around the county, since geographic shifts can and do affect the median price. In order to explore this concept, we break King County down into three regions, based on the NWMLS-defined “areas”: low end: South County (areas 100-130 &…
Local Foreclosures Flat in November
It’s time once again to expand on our preview of foreclosure activity with a more detailed look at November’s stats in King, Snohomish, and Pierce counties. First up, the Notice of Trustee Sale summary: November 2012 King: 870 NTS, up 106.7% YOY Snohomish: 536 NTS, up 168.0% YOY Pierce: 687 NTS, up 222.5% YOY All…
Non-Distressed Median Up Less Than 5% From 2011
Let’s check up on how median home sale prices broken down by distress status: Non-distressed, bank-owned, and short sales. As of November, the non-distressed median price for King County single family home sales sits at $430,000, up 4.9% from a year earlier. November matched this year’s high point from June. A 4.9% increase is decent,…