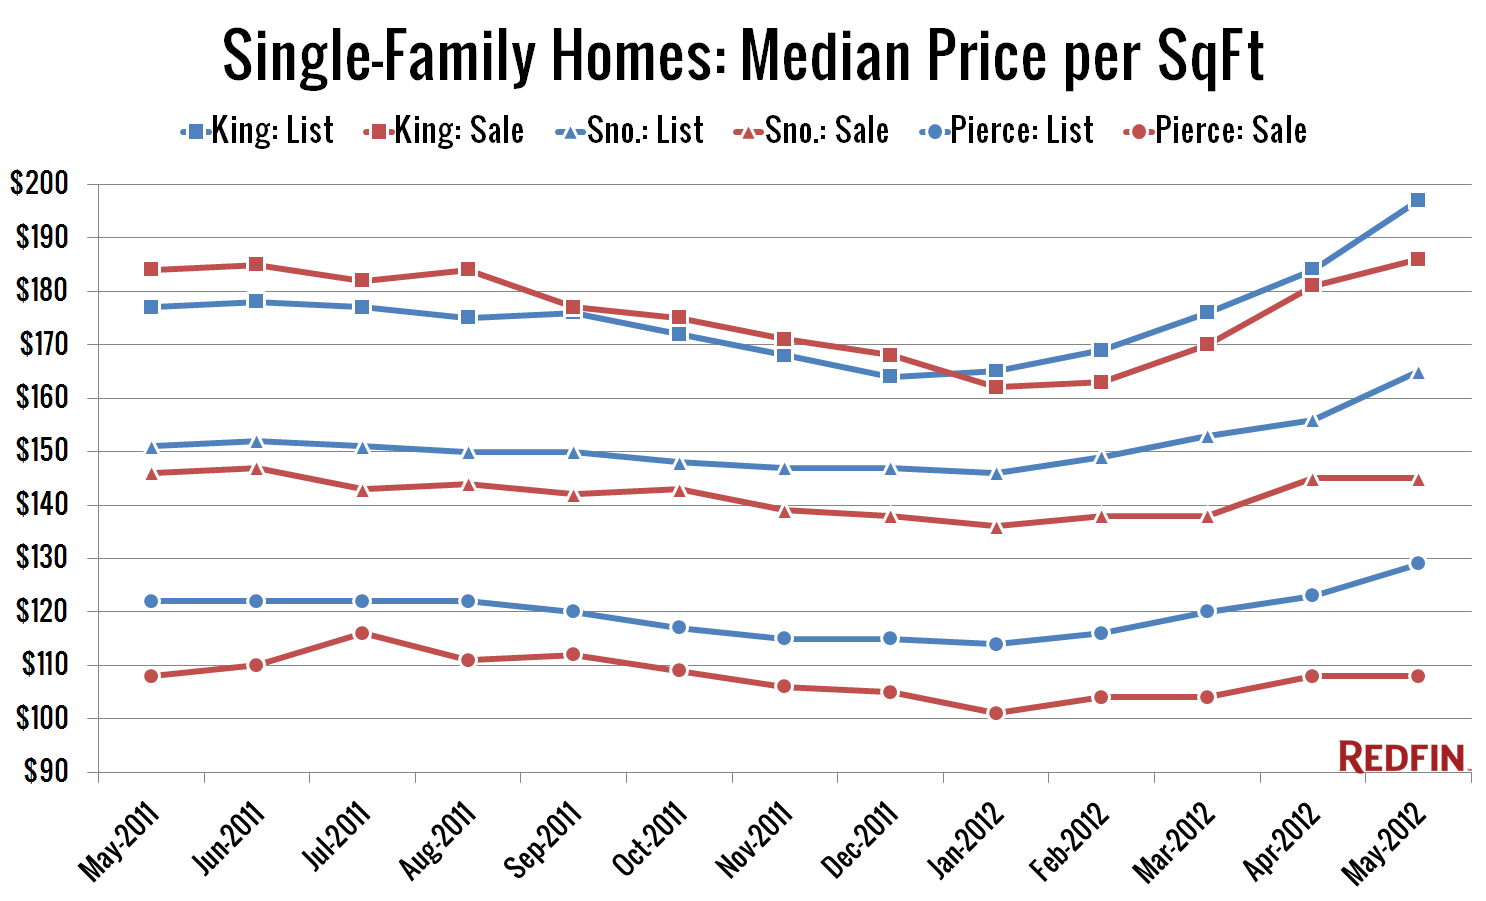
Full disclosure: The Tim is employed by Redfin. It’s been quite a while since I’ve posted any of the monthly market stats published by my employer, but since I’ve been spending a lot more time than usual knee-deep in these spreadsheets lately, I thought I’d share a few charts from the May update (xls). First…
Category: Statistics
Statistics, number-based analysis, etc.
May Stats Preview: Not Really a Preview Edition
Granted, I missed the pre-NWMLS stats window, but I’d still like to post the stats preview charts for May. Most of the charts below are based on broad county-wide data that is available through a simple search of King County and Snohomish County public records. If you have additional stats you’d like to see in…
NWMLS: Closed Sales Finally Break Back Above 2,000
May market stats were just released by the NWMLS. Two big firsts in this month’s data. The first month-to-month increase in inventory so far this year and the first time closed sales of single-family houses broke 2,000 in King County since August 2007. Now we finally know: Greg Perry’s 2009 prediction was just 3 years…
Are Listings Getting Less Scarce?
A reader emailed me to ask if I have “seen a bump in inventory” in the last few weeks. Unfortunately, I haven’t. Here’s a look at new listings by week since the beginning of the year, with last year plotted for comparison: The number of new listings each week did bump up a bit between…
Case-Shiller Tiers: Low Tier Drags Seattle Index Down
Let’s check out the three price tiers for the Seattle area, as measured by Case-Shiller. Remember, Case-Shiller’s “Seattle” data is based on single-family home repeat sales in King, Pierce, and Snohomish counties. Note that the tiers are determined by sale volume. In other words, 1/3 of all sales fall into each tier. For more details…
