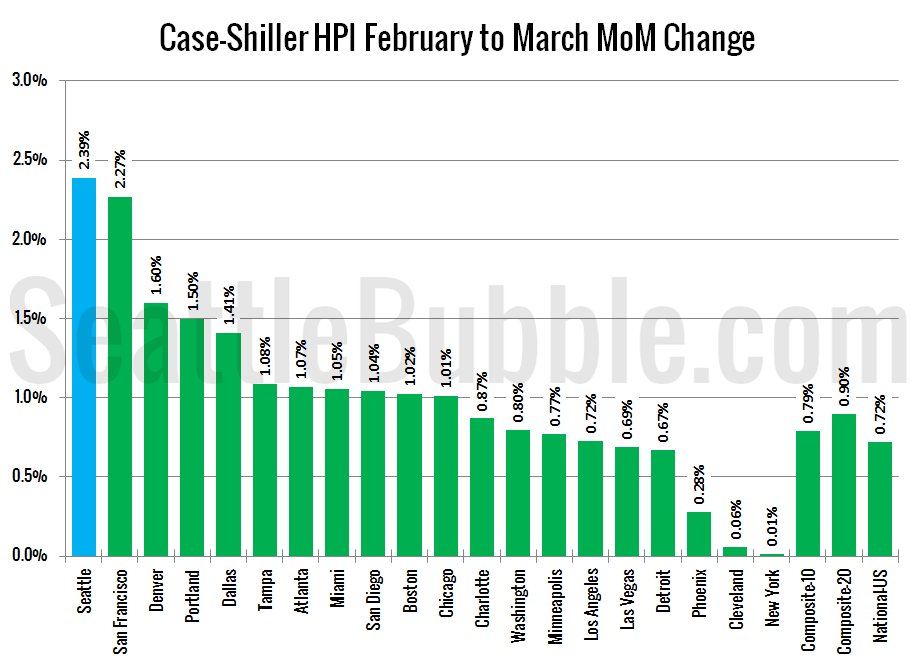
Let’s have a look at the latest data from the Case-Shiller Home Price Index. According to March data that was released today, Seattle-area home prices were: Up 2.4 percent February to March Up 10.8 percent YOY. Up 0.4 percent from the July 2007 peak Over the same period last year prices were up 2.3 percent…
Category: Statistics
Statistics, number-based analysis, etc.
NWMLS: Home Prices Hit Another Record as Sales Slow
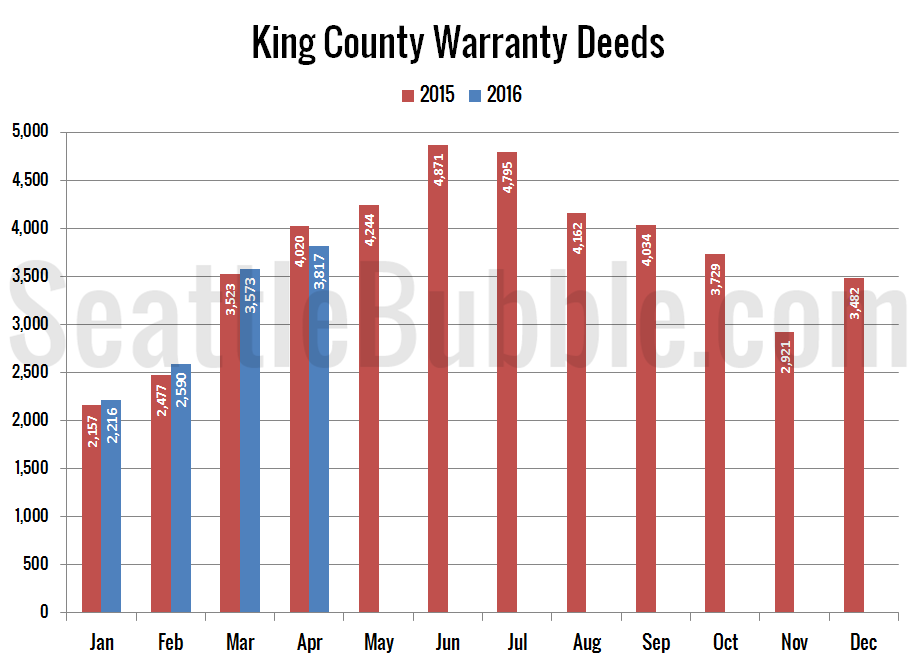
Get access to the full spreadsheets used to make the charts in this and other posts, as well as a variety of additional insider benefits by becoming a member of Seattle Bubble. April market stats were published by the NWMLS yesterday. Before we get into our monthly stats, here’s a quick look at their press…
April Stats Preview: Supply Increasing, Demand Decreasing
With April behind us, let’s have a look at our monthly stats preview. First up, here’s the snapshot of all the data as far back as my historical information goes, with the latest, high, and low values highlighted for each series: Inventory is still extremely low, but in King County the month-over-month increase was the…
Case-Shiller Tiers: High Tier Surpasses 2007 Peak Pricing
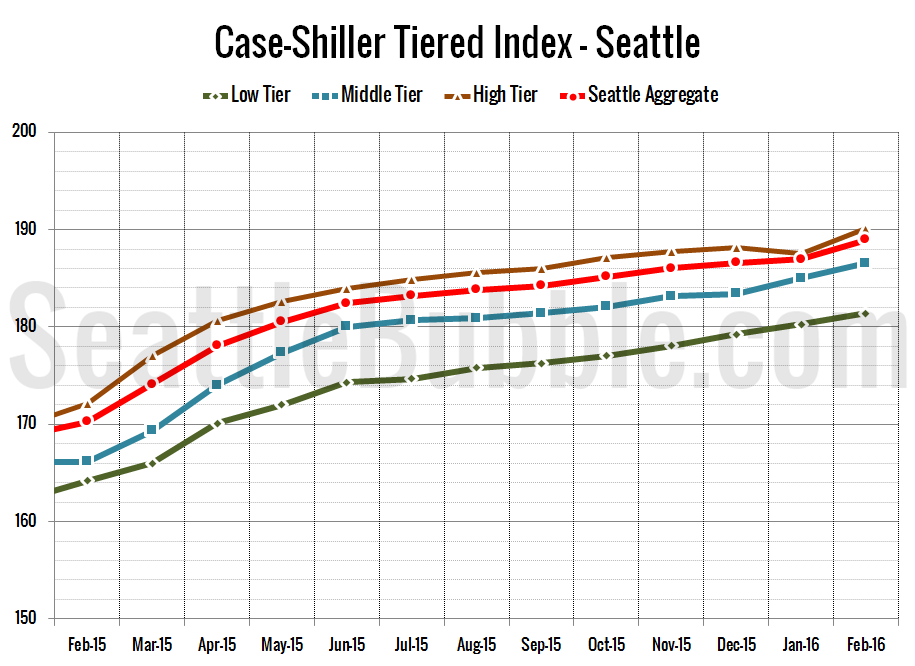
Let’s check out the three price tiers for the Seattle area, as measured by Case-Shiller. Remember, Case-Shiller’s “Seattle” data is based on single-family home repeat sales in King, Pierce, and Snohomish counties. Note that the tiers are determined by sale volume. In other words, 1/3 of all sales fall into each tier. For more details…
Case-Shiller: Seattle Sees Nation’s Biggest Price Gains
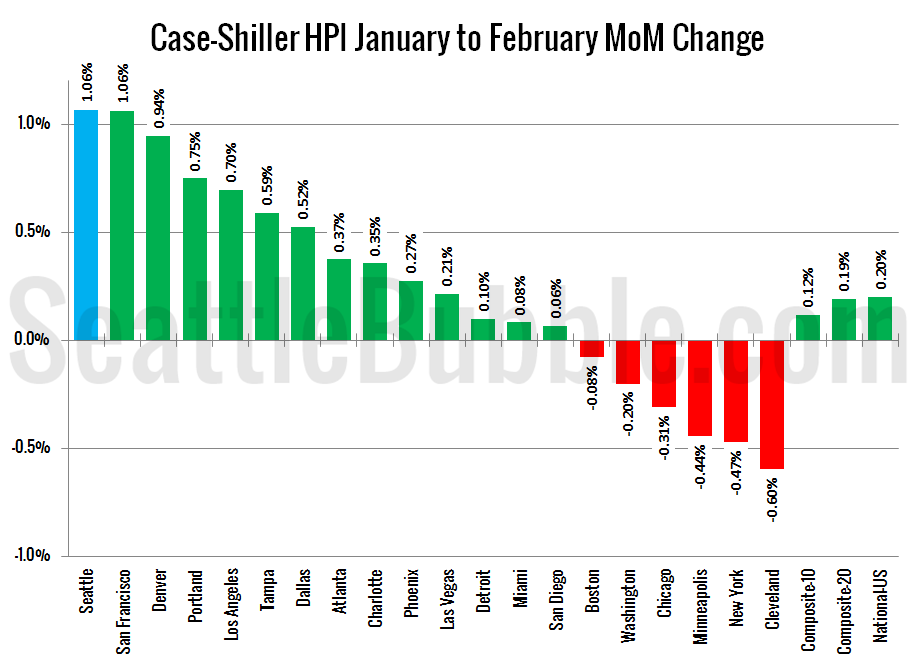
Let’s have a look at the latest data from the Case-Shiller Home Price Index. According to January data that was released today, Seattle-area home prices were: Up 1.1 percent January to February Up 11.0 percent YOY. Down 1.7 percent from the July 2007 peak Over the same period last year prices were up 0.9 percent…


