March market stats were published by the NWMLS yesterday. Before we get into our monthly stats, here’s a quick look at their press release. Frenzied Market Frustrating Buyers Buyer anxiety is rising as the pace of home sales is faster than brokers are able to replenish inventory, according to members of Northwest Multiple Listing Service….
Category: Statistics
Statistics, number-based analysis, etc.
Case-Shiller: Home Prices Slipped Just Slightly in January
Let’s have a look at the latest data from the Case-Shiller Home Price Index. According to January data, Seattle-area home prices were: Down 0.5% December to January Up 6.8% YOY. Down 12.2% from the July 2007 peak Last year at this time prices fell 0.8% month-over-month and year-over-year prices were up 11.9%. Year-over-year price gains…
NWMLS: Sales and Listings Both Inched Up in February
February market stats were published by the NWMLS yesterday. Before we get into our monthly stats, let’s have a look at their press release. Early Spring Brings Bumper Crop of Homebuyers Who Face Inventory Drought Favorable weather and restored confidence are propelling home buying activity around Western Washington to the highest level in nearly a…
February Stats Preview: Dead of Winter Edition
With February in the books, let’s have a look at our monthly stats preview. First up, here’s the snapshot of all the data as far back as my historical information goes, with the latest, high, and low values highlighted for each series: Listings inventory inched up from its January all-time low in King County, but…
Case-Shiller Tiers: A Mostly Flat December
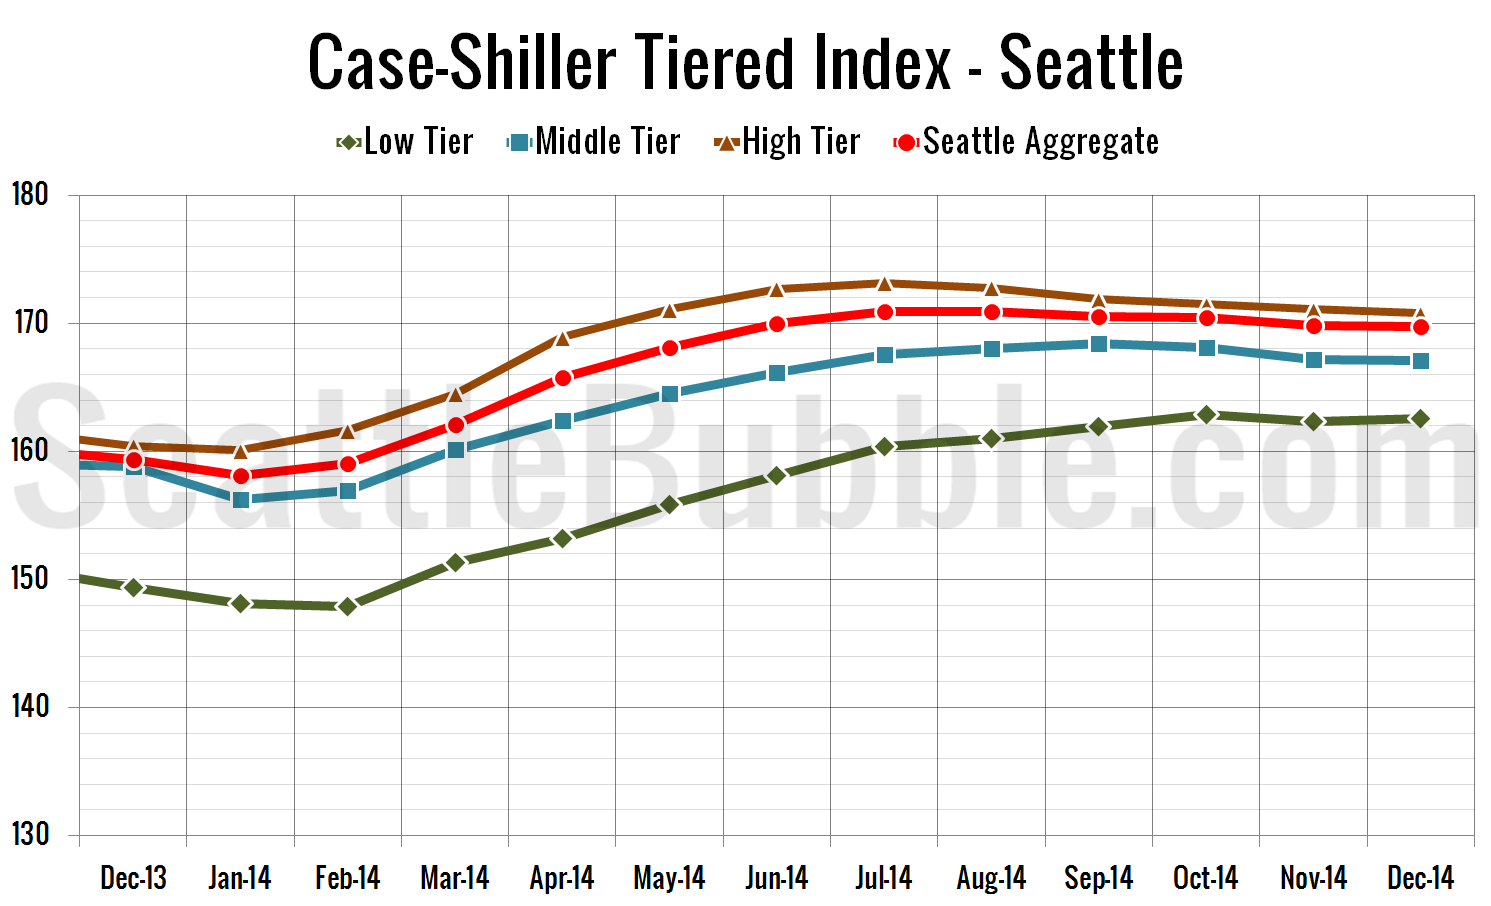
Let’s check out the three price tiers for the Seattle area, as measured by Case-Shiller. Remember, Case-Shiller’s “Seattle” data is based on single-family home repeat sales in King, Pierce, and Snohomish counties. Note that the tiers are determined by sale volume. In other words, 1/3 of all sales fall into each tier. For more details…


