Skip to content

Seattle Bubble

local real estate news, statistics, and commentary without the sales spin.

Menu
  • Home
  • About
  • Contact
  • Reference
  • Speaking
Menu

Category: Statistics

Statistics, number-based analysis, etc.

Seattle-Area Unemployment at Late 2008 Levels

Posted on April 3, 2014April 3, 2014 by The Tim

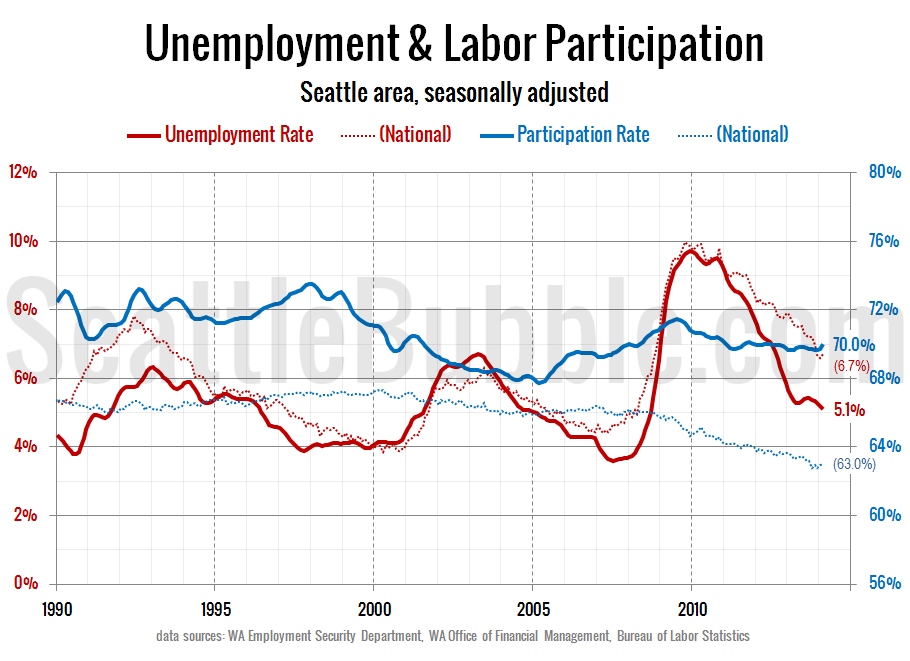
Let’s have a look at the jobs data for February and how the Seattle area’s unemployment rate and approximate labor participation rate alongside the national numbers. In February the Seattle area’s unemployment rate hit its lowest level since September 2008 at 5.1%. The national unemployment rate is still a bit higher at 6.7%, also roughly…

Share:

  • Twitter
  • LinkedIn
  • Facebook
  • Reddit
  • Pinterest
  • Email

March Stats Preview: Slumping Sales Edition

Posted on April 1, 2014April 1, 2014 by The Tim

With March now behind us, let’s have a look at our monthly stats preview. Most of the charts below are based on broad county-wide data that is available through a simple search of King County and Snohomish County public records. If you have additional stats you’d like to see in the preview, drop a line…

Share:

  • Twitter
  • LinkedIn
  • Facebook
  • Reddit
  • Pinterest
  • Email

Consumer Confidence Keeps Climbing

Posted on March 31, 2014March 28, 2014 by The Tim

Let’s check in on how Consumer Confidence and mortgage interest rates fared during January. First up, here’s the Consumer Confidence data as of March: At 81.0, the Present Situation Index increased 0.7% between February and March, and is up 34% from a year earlier. The Present Situation Index is currently up 301% from its December…

Share:

  • Twitter
  • LinkedIn
  • Facebook
  • Reddit
  • Pinterest
  • Email

Case-Shiller Second Derivative Suggests Softer Prices

Posted on March 28, 2014March 28, 2014 by The Tim

A reader requested an update to the second derivative chart of Seattle home prices, so here we go. This is a chart of the rate of change in the year-over-year change—the second derivative. For a more detailed explanation and some highlights of past inflection points, check out the original 2012 introduction of this chart. Here’s…

Share:

  • Twitter
  • LinkedIn
  • Facebook
  • Reddit
  • Pinterest
  • Email

Case-Shiller: Home Prices Weakest Since Early 2012

Posted on March 27, 2014March 27, 2014 by The Tim

Before we put away the January Case-Shiller data, let’s have a look at my favorite alternative Case-Shiller charts. First up, let’s take a look at the twenty-city month-over-month scorecard. Here’s the original post introducing this chart if you’d like more details. Click the image below for a super-wide version with the data back through 2000….

Share:

  • Twitter
  • LinkedIn
  • Facebook
  • Reddit
  • Pinterest
  • Email

Posts navigation

  • Previous
  • 1
  • …
  • 62
  • 63
  • 64
  • 65
  • 66
  • 67
  • 68
  • …
  • 222
  • Next

Tim’s Other Projects

Dispatches from the Multiverse

Tip Jar

Like what we're doing?

Drop us a tip!

Accounts

  • Log in
  • Entries feed
  • Comments feed
  • WordPress.org
©2024 Seattle Bubble | Built using WordPress and Responsive Blogily theme by Superb