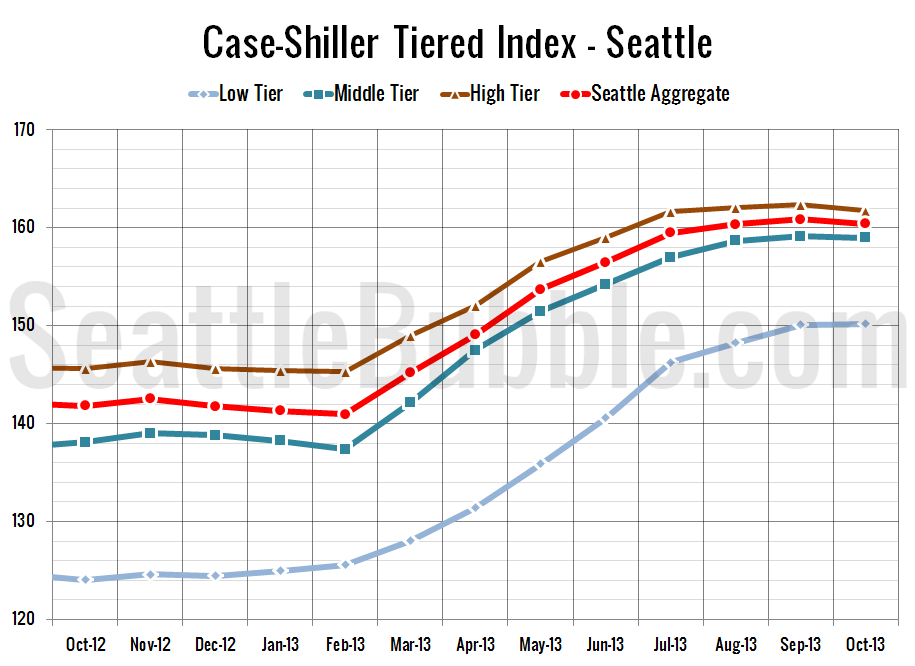
Let’s check out the three price tiers for the Seattle area, as measured by Case-Shiller. Remember, Case-Shiller’s “Seattle” data is based on single-family home repeat sales in King, Pierce, and Snohomish counties. Note that the tiers are determined by sale volume. In other words, 1/3 of all sales fall into each tier. For more details…
Category: Statistics
Statistics, number-based analysis, etc.
Case-Shiller: Seasonal Price Declines Begin in October
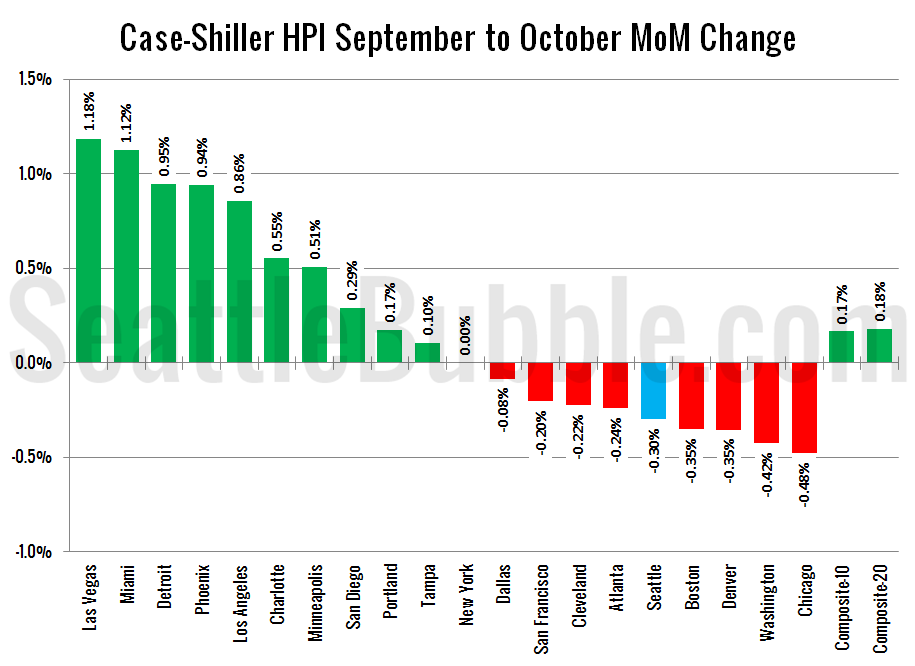
Happy new year! I’ve been fairly unplugged over the last couple of weeks, but I’m getting back into the swing of things now that we’re kicking off 2014. Let’s have a look at the latest data from the Case-Shiller Home Price Index. According to October data, Seattle-area home prices were: Down 0.3% September to October…
Manufacturing Jobs Slip as Job Growth Slows
Let’s take a look at the breakdown of what sectors are adding jobs locally and what sectors are losing jobs. I had intended to post this yesterday but the day got away from me. Sorry about that! First up, year-over-year job growth, broken down into a few relevant sectors over the past four years. Now…
Unemployment & Labor Participation Flat in November
Jobs data for November was released this week, so let’s take an updated look at the Seattle area’s unemployment rate and approximate labor participation rate alongside the national numbers. In November the Seattle area’s unemployment rate broke a four-month streak of increases, dipping just slightly from 5.7% in October to 5.6% last month. We are…
Median Price Drops Back Below Affordable Home Price
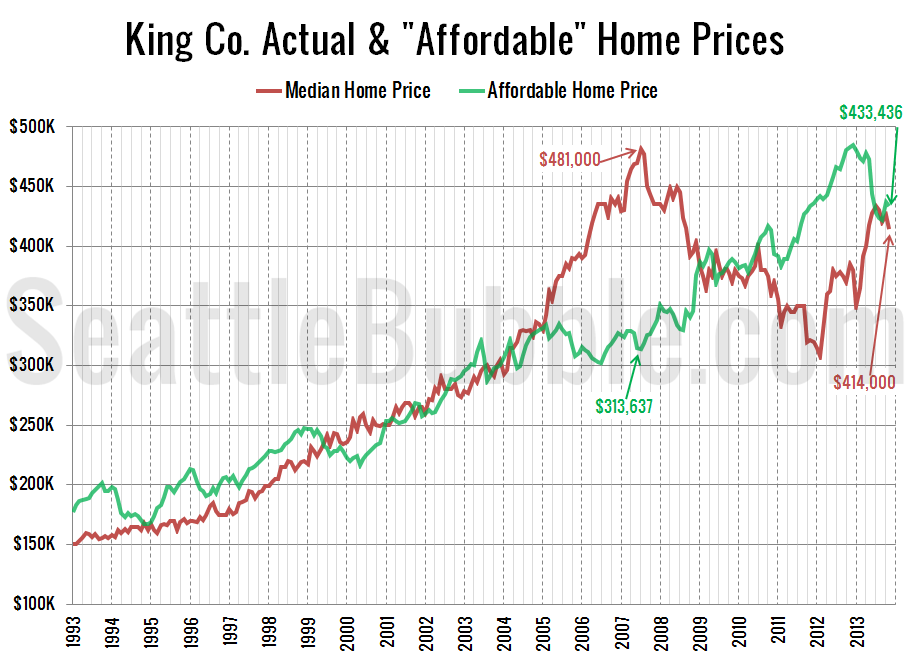
As promised in yesterday’s affordability post, here’s an updated look at the “affordable home” price chart. In this graph I flip the variables in the affordability index calculation around to other sides of the equation to calculate what price home the a family earning the median household income could afford to buy at today’s mortgage…


