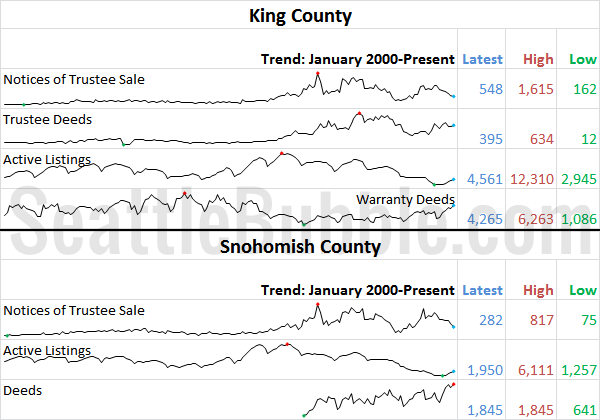
It’s time for our detailed look at July’s foreclosure stats in King, Snohomish, and Pierce counties. First up, the Notice of Trustee Sale summary: July 2013 King: 548 NTS, down 44% YOY Snohomish: 282 NTS, down 40% YOY Pierce: 429 NTS, down 16% YOY For the first time since June of last year, all three…
Category: Statistics
Statistics, number-based analysis, etc.

Home Prices and Sales Slip in South King
It’s time once again to take an updated look at how King County’s sales are shifting between the different regions around the county, since geographic shifts can and do affect the median price. In order to explore this concept, we break King County down into three regions, based on the NWMLS-defined “areas”: low end: South…

Consumer Confidence Unfazed by Interest Rates
It’s time for another check in on Consumer Confidence. Here’s the data as of July: At 73.6, the Present Situation Index increased 7% between June and July and has gained 264% from its December 2009 low point. The Present Situation Index now sits at its highest level since May 2008. The Expectations Index fell slightly…
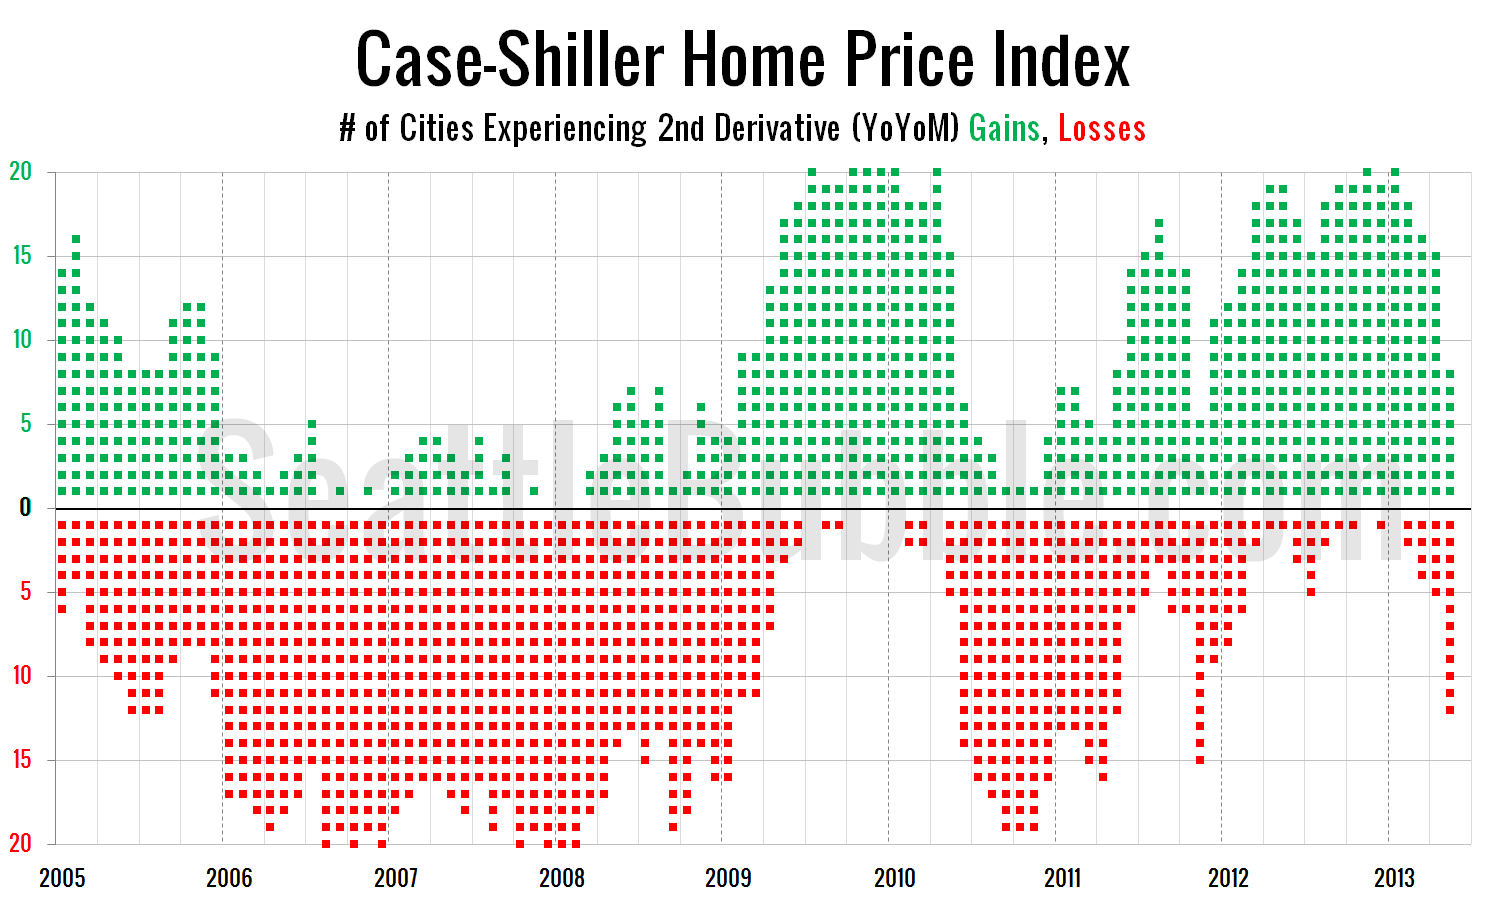
Case-Shiller: Second Derivative Gains Rapidly Evaporating
Before we put away the May Case-Shiller data, let’s have a look at my favorite alternative Case-Shiller charts. First up, let’s take a look at the twenty-city month-over-month scorecard. Here’s the original post introducing this chart if you’d like more details. Click the image below for a super-wide version with the data back through 2000….
July Stats Preview: Ongoing Inventory Recovery Edition
Now that the month of July is behind us, let’s have a look at our stats preview. Most of the charts below are based on broad county-wide data that is available through a simple search of King County and Snohomish County public records. If you have additional stats you’d like to see in the preview,…