Skip to content

Seattle Bubble

local real estate news, statistics, and commentary without the sales spin.

Menu
  • Home
  • About
  • Contact
  • Reference
  • Speaking
Menu

Category: Statistics

Statistics, number-based analysis, etc.

Listings Keep Shrinking; Very Few Homes Delisted in 2012

Posted on February 21, 2013February 21, 2013 by The Tim

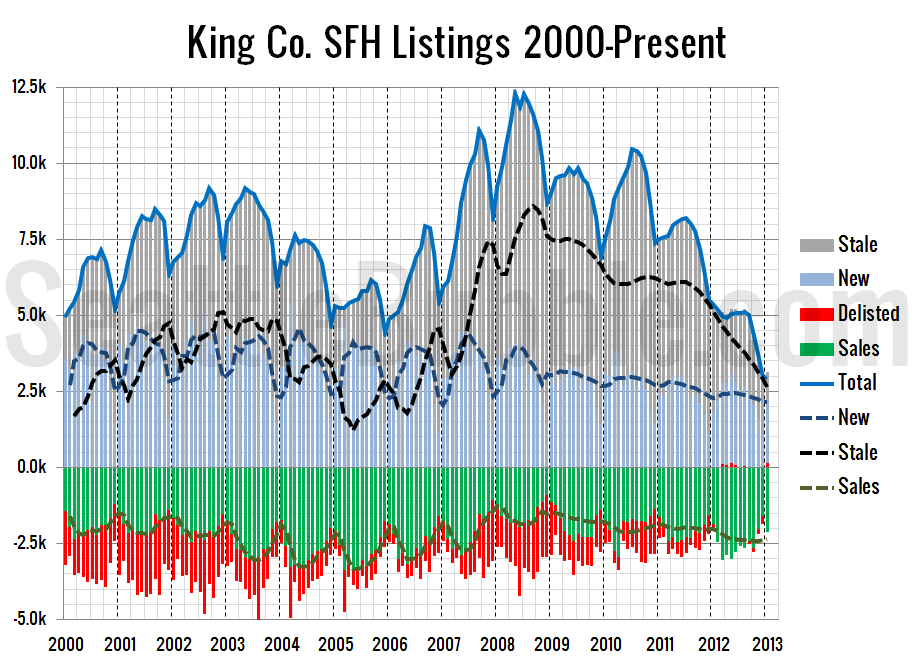
Here’s a view on listings that we haven’t visited in a while. In this chart I use the NWMLS-published data on new listings, pending sales, and total inventory to visualize the inflow and outflow of single-family listings in King County. First up is a chart that goes back as far as NWMLS data is available:…

Share:

  • Twitter
  • LinkedIn
  • Facebook
  • Reddit
  • Pinterest
  • Email

Distressed Inventory Shortage to Blame for Listings Drought

Posted on February 20, 2013February 20, 2013 by The Tim

Full disclosure: The Tim is employed by Redfin. Let’s take a brief follow-up look at new listings. When we checked in two weeks into the new year, new listings in the Seattle area were down 25% from 2012. The data from this post is largely pulled out of a larger-scale analysis I did at work…

Share:

  • Twitter
  • LinkedIn
  • Facebook
  • Reddit
  • Pinterest
  • Email

Expensive Home Sales Dropped Off Dramatically in January

Posted on February 19, 2013February 19, 2013 by The Tim

Let’s have another look at our monthly sales histogram. After flattening out somewhat between November and December the sales distribution curve became much steeper in January as sales above $300,000 fell off dramatically. In December the mode (i.e. the bucket with the most sales) for non-distressed sales was at $350,000 to $400,000, but in January…

Share:

  • Twitter
  • LinkedIn
  • Facebook
  • Reddit
  • Pinterest
  • Email

Foreclosures Start 2013 Elevated

Posted on February 14, 2013February 14, 2013 by The Tim

It’s time once again to expand on our preview of foreclosure activity with a more detailed look at January’s stats in King, Snohomish, and Pierce counties. First up, the Notice of Trustee Sale summary: January 2013 King: 1,060 NTS, up 154% YOY Snohomish: 566 NTS, up 141% YOY Pierce: 723 NTS, up 156% YOY All…

Share:

  • Twitter
  • LinkedIn
  • Facebook
  • Reddit
  • Pinterest
  • Email

Low End Sales Spike, High End Slips

Posted on February 13, 2013February 13, 2013 by The Tim

Let’s take an updated look at how King County’s sales are shifting between the different regions around the county, since geographic shifts can and do affect the median price. In order to explore this concept, we break King County down into three regions, based on the NWMLS-defined “areas”: low end: South County (areas 100-130 &…

Share:

  • Twitter
  • LinkedIn
  • Facebook
  • Reddit
  • Pinterest
  • Email

Posts navigation

  • Previous
  • 1
  • …
  • 93
  • 94
  • 95
  • 96
  • 97
  • 98
  • 99
  • …
  • 222
  • Next

Tim’s Other Projects

Dispatches from the Multiverse

Tip Jar

Like what we're doing?

Drop us a tip!

Accounts

  • Log in
  • Entries feed
  • Comments feed
  • WordPress.org
©2024 Seattle Bubble | Built using WordPress and Responsive Blogily theme by Superb